其实就是安装,然后了解下其模块功能具体能实现什么?
我这个是Kibana+elastic对系统监控的一个测试。
Elasticsearch是用Java开发的开源全文搜索引擎
Elasticsearch 是个开源分布式搜索引擎,它的特点有:分布式,零配置,自动发现,索引自动分片,索引副本机制, restful 风格接口,多数据源,自动搜索负载等
部分参考:
https://www.elastic.co/downloads/elasticsearch
https://www.elastic.co/guide/en/elasticsearch/reference/7.10/brew.html
http://www.ruanyifeng.com/blog/2017/08/elasticsearch.html
基本环境信息
操作系统:macOS Big Sur 11.1
JDK版本:1.8
java -version
java version "1.8.0_261"
Java(TM) SE Runtime Environment (build 1.8.0_261-b12)
Java HotSpot(TM) 64-Bit Server VM (build 25.261-b12, mixed mode)
➜ modules.d
ES版本:7.10.2
ES7.10版本默认指定的是jdk11,这里因为我安装的是jdk8,也能使用。
最终查看版本如下:
 elasticsearch -version
future versions of Elasticsearch will require Java 11; your Java version from [/Library/Internet Plug-Ins/JavaAppletPlugin.plugin/Contents/Home] does not meet this requirement
future versions of Elasticsearch will require Java 11; your Java version from [/Library/Internet Plug-Ins/JavaAppletPlugin.plugin/Contents/Home] does not meet this requirement
Version: 7.10.2, Build: default/tar/747e1cc71def077253878a59143c1f785afa92b9/2021-01-13T00:42:12.435326Z, JVM: 1.8.0_261
https://www.elastic.co/guide/en/elasticsearch/reference/7.10/brew.html
Install Elasticsearch on macOS with Homebrew
安装过程:
➜  ~ brew tap elastic/tap
➜  ~ brew install elastic/tap/elasticsearch-fullUpdating
直接启动看看
➜  ~ brew services start elastic/tap/elasticsearch-full
==> Successfully started `elasticsearch-full` (label: homebrew.mxcl.elasticsearch-full)
查看日志:
➜ ~ tail -f /usr/local/var/log/elasticsearch/elasticsearch_lex.log
[2021-01-15T15:48:33,049][INFO ][o.e.x.s.s.SecurityStatusChangeListener] [Mac] Active license is now [BASIC]; Security is disabled
访问测试下:
➜  ~ curl http://127.0.0.1:9200
{
  "name" : "Mac",
  "cluster_name" : "elasticsearch_lex",
  "cluster_uuid" : "AG1c93qcRSmRAhot6vLiaw",
  "version" : {
    "number" : "7.10.2",
    "build_flavor" : "default",
    "build_type" : "tar",
    "build_hash" : "747e1cc71def077253878a59143c1f785afa92b9",
    "build_date" : "2021-01-13T00:42:12.435326Z",
    "build_snapshot" : false,
    "lucene_version" : "8.7.0",
    "minimum_wire_compatibility_version" : "6.8.0",
    "minimum_index_compatibility_version" : "6.0.0-beta1"
  },
  "tagline" : "You Know, for Search"
}
Index
Elastic 会索引所有字段,经过处理后写入一个反向索引(Inverted Index)。查找数据的时候,直接查找该索引。
所以,Elastic 数据管理的顶层单位就叫做 Index(索引)。它是单个数据库的同义词。每个 Index (即数据库)的名字必须是小写。
下面的命令可以查看当前节点的所有 Index。
➜ ~ curl -X GET 'http://localhost:9200/_cat/indices?v'
health status index uuid pri rep docs.count docs.deleted store.size pri.store.size
上面结果是空的,因为没有index
新建 Index,可以直接向 Elastic 服务器发出 PUT 请求。下面的例子是新建一个名叫weather的 Index
➜ ~ curl -X PUT 'localhost:9200/weather'
{"acknowledged":true,"shards_acknowledged":true,"index":"weather"}%
➜ ~ curl -X GET 'http://localhost:9200/_cat/indices?v'
再次查看
health status index uuid pri rep docs.count docs.deleted store.size pri.store.size
yellow open weather 4ZOIurPQQLOZ8SEz_CFtzw 1 1 0 0 208b 208b
参考:
https://github.com/elastic/elasticsearch
Indexing
First, index some sample JSON documents. The first request automatically creates the my-index-000001 index.
➜  ~ curl -X POST 'http://localhost:9200/my-index-000001/_doc?pretty' -H 'Content-Type: application/json' -d '
{
  "@timestamp": "2099-11-15T13:12:00",
  "message": "GET /search HTTP/1.1 200 1070000",
  "user": {
    "id": "kimchy"
  }
}'
{
  "_index" : "my-index-000001",
  "_type" : "_doc",
  "_id" : "zCccBXcB3jLqk4arrmzo",
  "_version" : 1,
  "result" : "created",
  "_shards" : {
    "total" : 2,
    "successful" : 1,
    "failed" : 0
  },
  "_seq_no" : 0,
  "_primary_term" : 1
}
➜  ~ curl -X POST 'http://localhost:9200/my-index-000001/_doc?pretty' -H 'Content-Type: application/json' -d '
{
  "@timestamp": "2099-11-15T14:12:12",
  "message": "GET /search HTTP/1.1 200 1070000",
  "user": {
    "id": "elkbee"
  }
}'
{
  "_index" : "my-index-000001",
  "_type" : "_doc",
  "_id" : "zSccBXcB3jLqk4ar1mzX",
  "_version" : 1,
  "result" : "created",
  "_shards" : {
    "total" : 2,
    "successful" : 1,
    "failed" : 0
  },
  "_seq_no" : 1,
  "_primary_term" : 1
}
➜  ~ curl -X POST 'http://localhost:9200/my-index-000001/_doc?pretty' -H 'Content-Type: application/json' -d '
{
  "@timestamp": "2099-11-15T01:46:38",
  "message": "GET /search HTTP/1.1 200 1070000",
  "user": {
    "id": "elkbee"
  }
}'
{
  "_index" : "my-index-000001",
  "_type" : "_doc",
  "_id" : "ziccBXcB3jLqk4ar-2wT",
  "_version" : 1,
  "result" : "created",
  "_shards" : {
    "total" : 2,
    "successful" : 1,
    "failed" : 0
  },
  "_seq_no" : 2,
  "_primary_term" : 1
}
➜  ~ curl -X GET 'http://localhost:9200/_cat/indices?v'
health status index           uuid                   pri rep docs.count docs.deleted store.size pri.store.size
yellow open   weather         4ZOIurPQQLOZ8SEz_CFtzw   1   1          0            0       208b           208b
yellow open   my-index-000001 YrCXWqZSQoahuQpmyDdoMg   1   1          3            0     14.1kb         14.1kb
Search
Next, use a search request to find any documents with a user.id of kimchy.
➜  ~ curl -X GET 'http://localhost:9200/my-index-000001/_search?q=user.id:kimchy&pretty=true'
{
  "took" : 63,
  "timed_out" : false,
  "_shards" : {
    "total" : 1,
    "successful" : 1,
    "skipped" : 0,
    "failed" : 0
  },
  "hits" : {
    "total" : {
      "value" : 1,
      "relation" : "eq"
    },
    "max_score" : 0.9808291,
    "hits" : [
      {
        "_index" : "my-index-000001",
        "_type" : "_doc",
        "_id" : "zCccBXcB3jLqk4arrmzo",
        "_score" : 0.9808291,
        "_source" : {
          "@timestamp" : "2099-11-15T13:12:00",
          "message" : "GET /search HTTP/1.1 200 1070000",
          "user" : {
            "id" : "kimchy"
          }
        }
      }
    ]
  }
}
Kibana是ES的一个配套工具,让用户在网页中可以直接与ES进行交互。
安装:brew install kibana
安装完后执行:kibana 启动
Kibana的默认端口是5601
~ brew install kibana
Updating Homebrew...
==> Downloading https://mirrors.aliyun.com/homebrew/homebrew-bottles/bottles/node%4010-10.23.0.big_sur.bottle.tar.gz
######################################################################## 100.0%
==> Downloading https://mirrors.aliyun.com/homebrew/homebrew-bottles/bottles/kibana-7.10.0.big_sur.bottle.tar.gz
######################################################################## 100.0%
==> Installing dependencies for kibana: node@10
==> Installing kibana dependency: node@10
==> Pouring node@10-10.23.0.big_sur.bottle.tar.gz
==> Caveats
node@10 is keg-only, which means it was not symlinked into /usr/local,
because this is an alternate version of another formula.

If you need to have node@10 first in your PATH run:
  echo 'export PATH="/usr/local/opt/node@10/bin:$PATH"' >> ~/.zshrc

For compilers to find node@10 you may need to set:
  export LDFLAGS="-L/usr/local/opt/node@10/lib"
  export CPPFLAGS="-I/usr/local/opt/node@10/include"

==> Summary
  /usr/local/Cellar/node@10/10.23.0: 4,259 files, 53.9MB
==> Installing kibana
==> Pouring kibana-7.10.0.big_sur.bottle.tar.gz
==> Caveats
Config: /usr/local/etc/kibana/
If you wish to preserve your plugins upon upgrade, make a copy of
/usr/local/opt/kibana/plugins before upgrading, and copy it into the
new keg location after upgrading.

To have launchd start kibana now and restart at login:
  brew services start kibana
Or, if you don't want/need a background service you can just run:
  kibana
==> Summary
  /usr/local/Cellar/kibana/7.10.0: 28,831 files, 297.5MB
==> Caveats
==> node@10
node@10 is keg-only, which means it was not symlinked into /usr/local,
because this is an alternate version of another formula.

If you need to have node@10 first in your PATH run:
  echo 'export PATH="/usr/local/opt/node@10/bin:$PATH"' >> ~/.zshrc

For compilers to find node@10 you may need to set:
  export LDFLAGS="-L/usr/local/opt/node@10/lib"
  export CPPFLAGS="-I/usr/local/opt/node@10/include"

==> kibana
Config: /usr/local/etc/kibana/
If you wish to preserve your plugins upon upgrade, make a copy of
/usr/local/opt/kibana/plugins before upgrading, and copy it into the
new keg location after upgrading.

To have launchd start kibana now and restart at login:
  brew services start kibana
Or, if you don't want/need a background service you can just run:
  kibana
➜ ~ brew services list
Name               Status  User Plist
bind               stopped
elasticsearch-full started lex  /Users/lex/Library/LaunchAgents/homebrew.mxcl.elasticsearch-full.plist
grafana            stopped
influxdb           stopped
kibana             started lex  /Users/lex/Library/LaunchAgents/homebrew.mxcl.kibana.plist
node_exporter      started lex  /Users/lex/Library/LaunchAgents/homebrew.mxcl.node_exporter.plist
prometheus         stopped
unbound            stopped
安装组合之后,就可以OK了
http://127.0.0.1:5601/app/home#/

https://www.elastic.co/what-is/elastic-stack-security?blade=kibanasecuritymessage
数据安全应该是要加账户之类的
http://127.0.0.1:5601/app/dashboards#/view/Metricbeat-system-overview-ecs?_g=(filters:!(),refreshInterval:(pause:!t,value:0),time:(from:now-15m,to:now))&_a=(description:'Overview%20of%20system%20metrics',filters:!(),fullScreenMode:!f,options:(darkTheme:!f),query:(language:kuery,query:''),timeRestore:!f,title:'%5BMetricbeat%20System%5D%20Overview%20ECS',viewMode:view)
添加数据
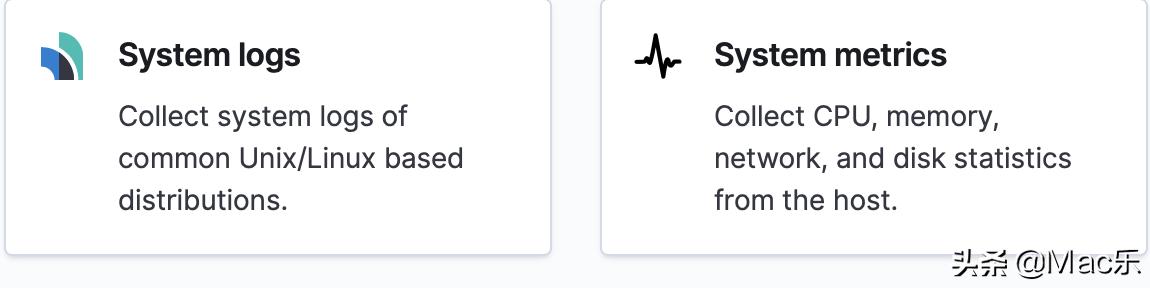
http://127.0.0.1:5601/app/home#/tutorial/systemMetrics
关于metricbeat可以参考官方文档:
https://www.elastic.co/guide/en/beats/metricbeat/7.10/metricbeat-installation-configuration.html
curl -L -O https://artifacts.elastic.co/downloads/beats/metricbeat/metricbeat-7.10.0-darwin-x86_64.tar.gz
tar xzvf metricbeat-7.10.0-darwin-x86_64.tar.gz
cd metricbeat-7.10.0-darwin-x86_64/
➜  metricbeat-7.10.0-darwin-x86_64 ls
LICENSE.txt  README.md   kibana      metricbeat.reference.yml  module
NOTICE.txt   fields.yml  metricbeat  metricbeat.yml            modules.d
➜  metricbeat-7.10.0-darwin-x86_64 cp metricbeat.yml metricbeat.yml`date +%F`
➜  metricbeat-7.10.0-darwin-x86_64 pwd
/Users/lex/Downloads/Package/metricbeat-7.10.0-darwin-x86_64
➜  metricbeat-7.10.0-darwin-x86_64 ls
LICENSE.txt  fields.yml  metricbeat.reference.yml  module
NOTICE.txt   kibana      metricbeat.yml            modules.d
README.md    metricbeat  metricbeat.yml2021-01-15
➜  metricbeat-7.10.0-darwin-x86_64 pwd
/Users/lex/Downloads/Package/metricbeat-7.10.0-darwin-x86_64
➜  metricbeat-7.10.0-darwin-x86_64 ./metricbeat modules enable system
Module system is already enabled
➜  metricbeat-7.10.0-darwin-x86_64 ./metricbeat setup
Overwriting ILM policy is disabled. Set `setup.ilm.overwrite: true` for enabling.


Index setup finished.
Loading dashboards (Kibana must be running and reachable)


Exiting: Failed to import dashboard: Failed to load directory /Users/lex/Downloads/Package/metricbeat-7.10.0-darwin-x86_64/kibana/7/dashboard:
  error loading /Users/lex/Downloads/Package/metricbeat-7.10.0-darwin-x86_64/kibana/7/dashboard/Metricbeat-aws-billing-overview.json: . Response: {"objects":[{"type":"dashboard","id":"e6776b10-1534-11ea-841c-01bf20a6c8ba","attributes":{"description":"Overview of AWS Billing Metrics","hits":0,"kibanaSavedObjectMeta":{"searchSourceJSON":"{\"filter\": [], \"query\": {\"language\": \"kuery\", \"qu... (truncated)
  error loading /Users/lex/Downloads/Package/metricbeat-7.10.0-darwin-x86_64/kibana/7/dashboard/Metricbeat-azure-app-state-overview.json: . Response: {"objects":[{"type":"dashboard","id":"d5fbd610-03d9-11eb-8034-63f2039e9d3f","attributes":{"description":"Provides relevant app insights metrics for web applications","hits":0,"kibanaSavedObjectMeta":{"searchSourceJSON":"{\"filter\": [{\"meta\": {\"in... (truncated)
  error loading /Users/lex/Downloads/Package/metricbeat-7.10.0-darwin-x86_64/kibana/7/dashboard/Metricbeat-googlecloud-billing-overview.json: . Response: {"objects":[{"type":"dashboard","id":"76c9e920-e890-11ea-bf8c-d13ebf358a78","attributes":{"description":"Overview of Google Cloud Billing Metrics","hits":0,"kibanaSavedObjectMeta":{"searchSourceJSON":"{\"filter\": [], \"query\": {\"language\": \"kuer... (truncated)
  error loading /Users/lex/Downloads/Package/metricbeat-7.10.0-darwin-x86_64/kibana/7/dashboard/Metricbeat-googlecloud-pubsub-overview.json: . Response: {"objects":[{"type":"dashboard","id":"2b0fd7b0-feac-11ea-b032-d59f894a5072","attributes":{"description":"Overview of Googlecloud PubSub Metrics","hits":0,"kibanaSavedObjectMeta":{"searchSourceJSON":"{\"filter\": [], \"query\": {\"language\": \"kuery\... (truncated)


metricbeat-7.10.0-darwin-x86_64 ./metricbeat --help
Usage:
  metricbeat [flags]
  metricbeat [command]


Available Commands:
  enroll      Enroll in Kibana for Central Management
  export      Export current config or index template
  help        Help about any command
  keystore    Manage secrets keystore
  modules     Manage configured modules
  run         Run metricbeat
  setup       Setup index template, dashboards and ML jobs
  test        Test config
  version     Show current version info


Flags:
  -E, --E setting=value              Configuration overwrite
  -N, --N                            Disable actual publishing for testing
  -c, --c string                     Configuration file, relative to path.config (default "metricbeat.yml")
      --cpuprofile string            Write cpu profile to file
  -d, --d string                     Enable certain debug selectors
  -e, --e                            Log to stderr and disable syslog/file output

 -e, --e                            Log to stderr and disable syslog/file output参数
➜  metricbeat-7.10.0-darwin-x86_64 ./metricbeat -e可以看到日志
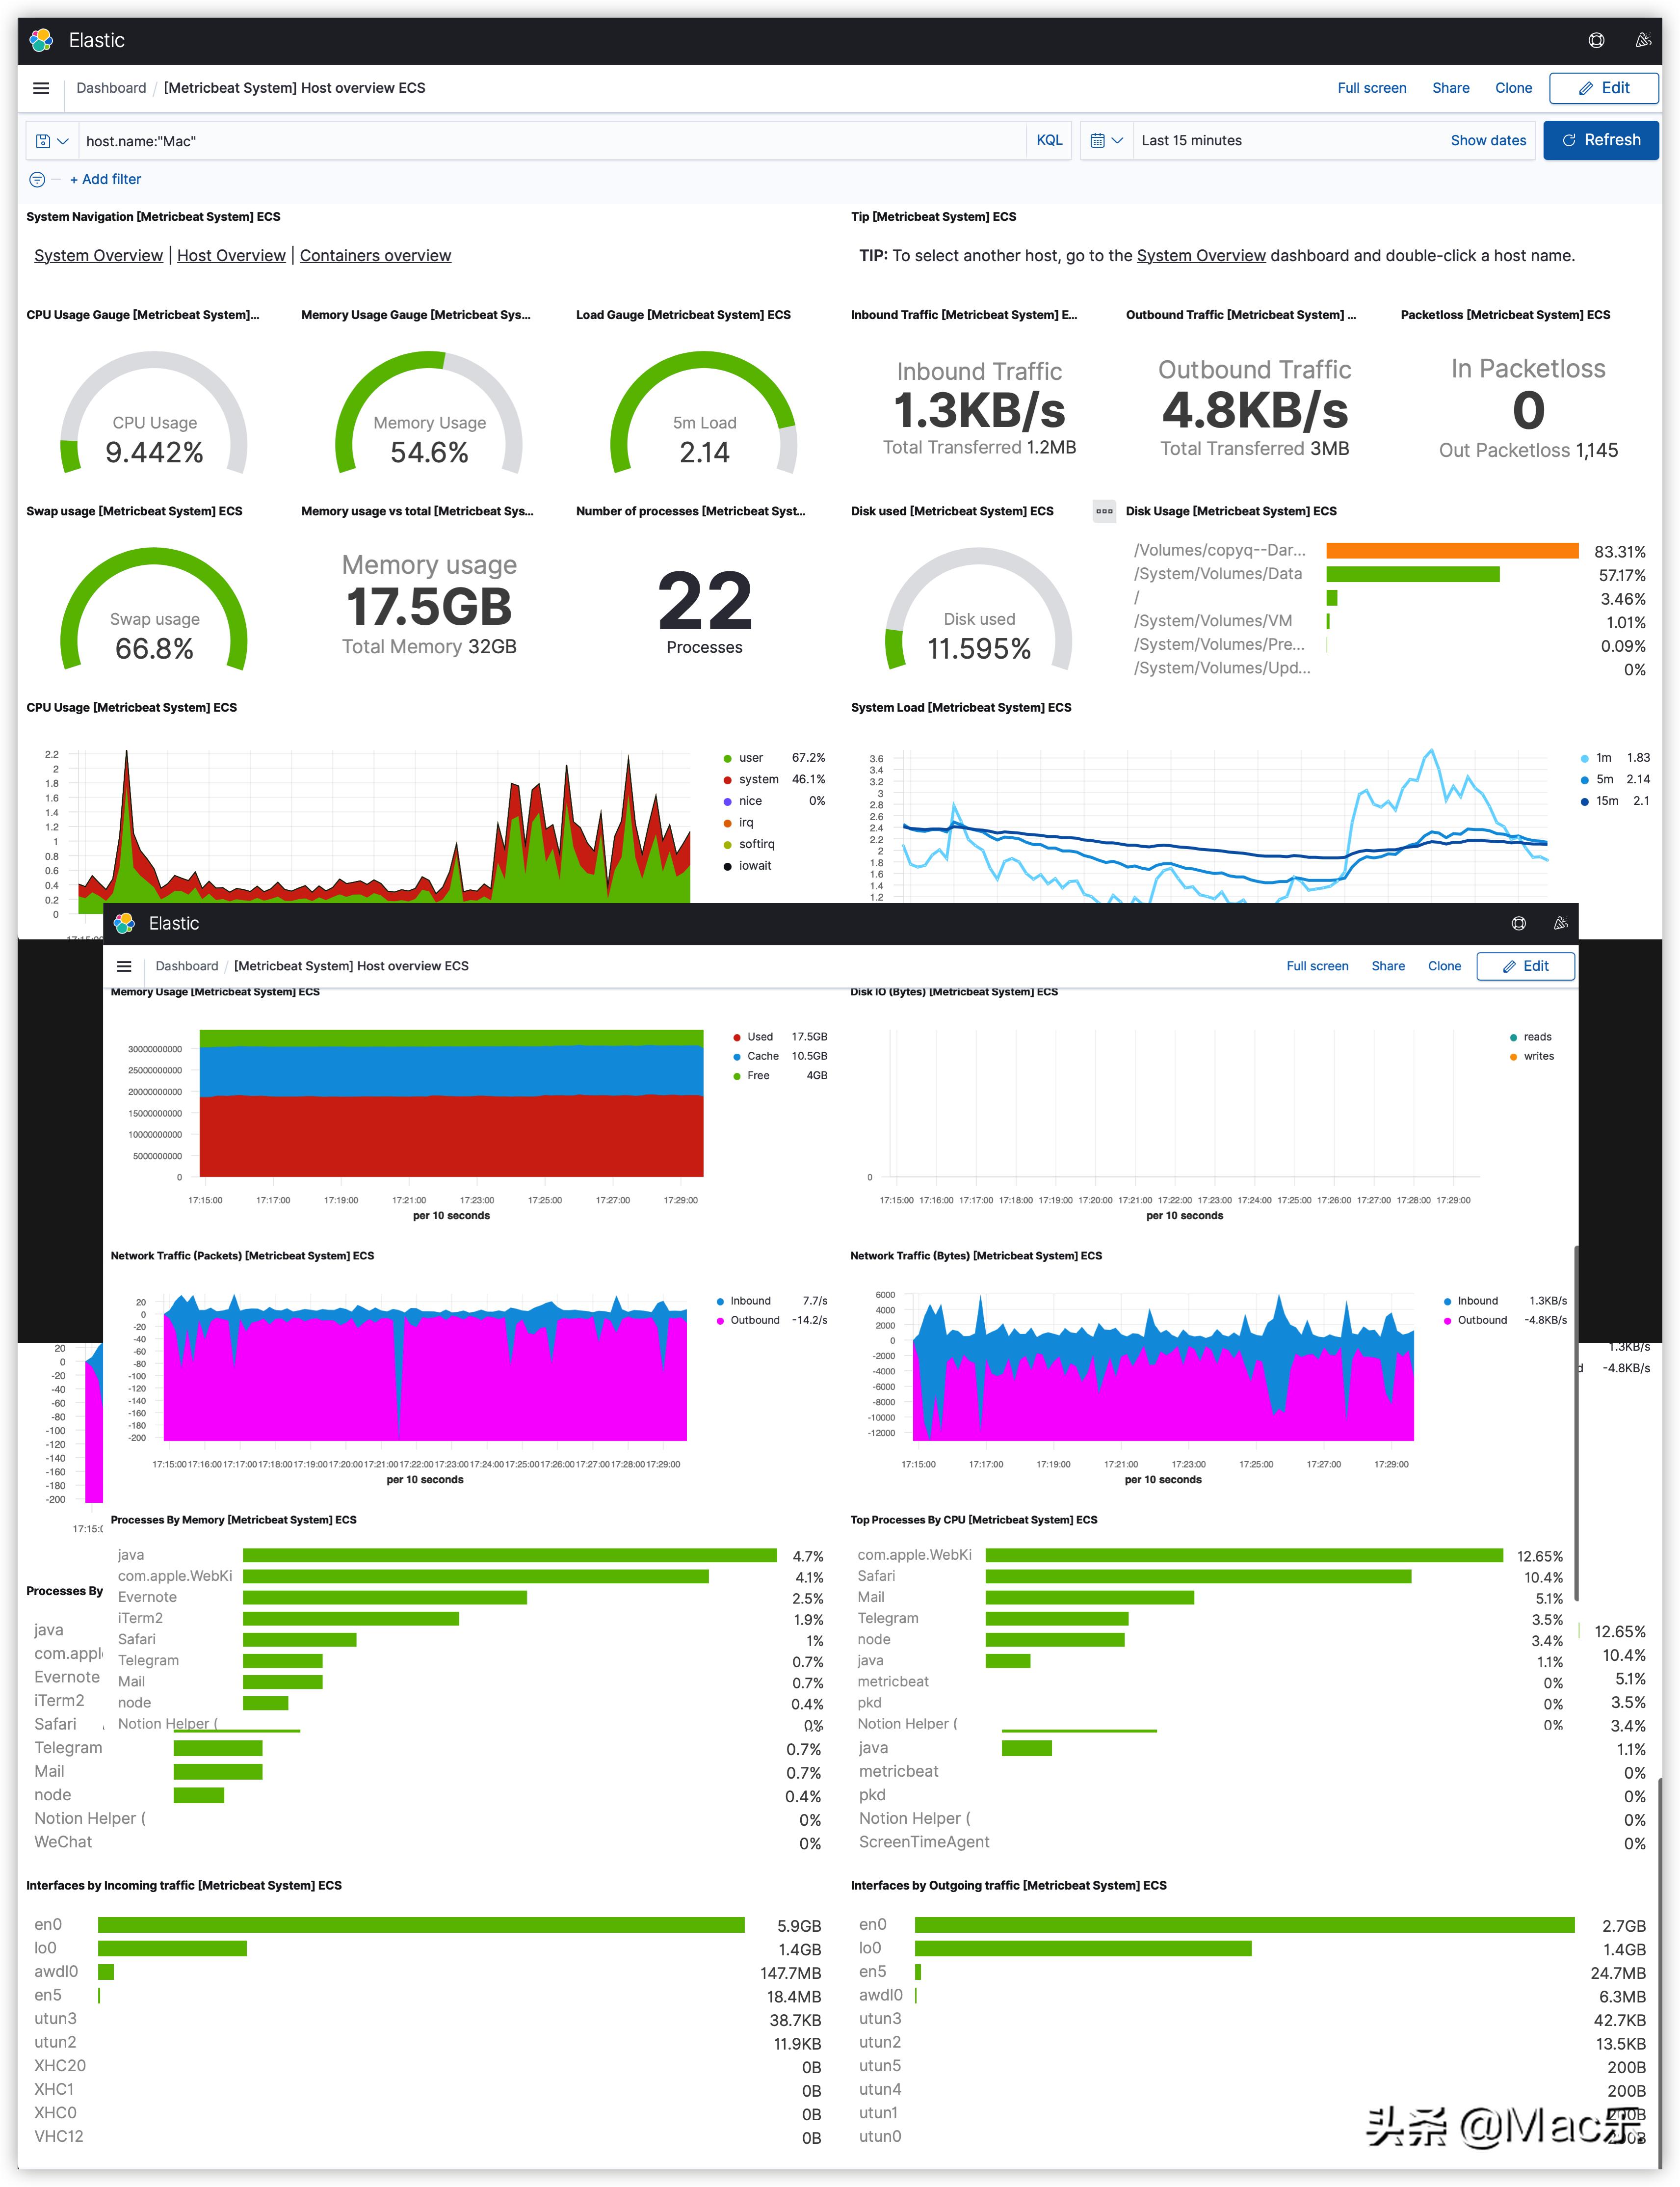
看下效果:
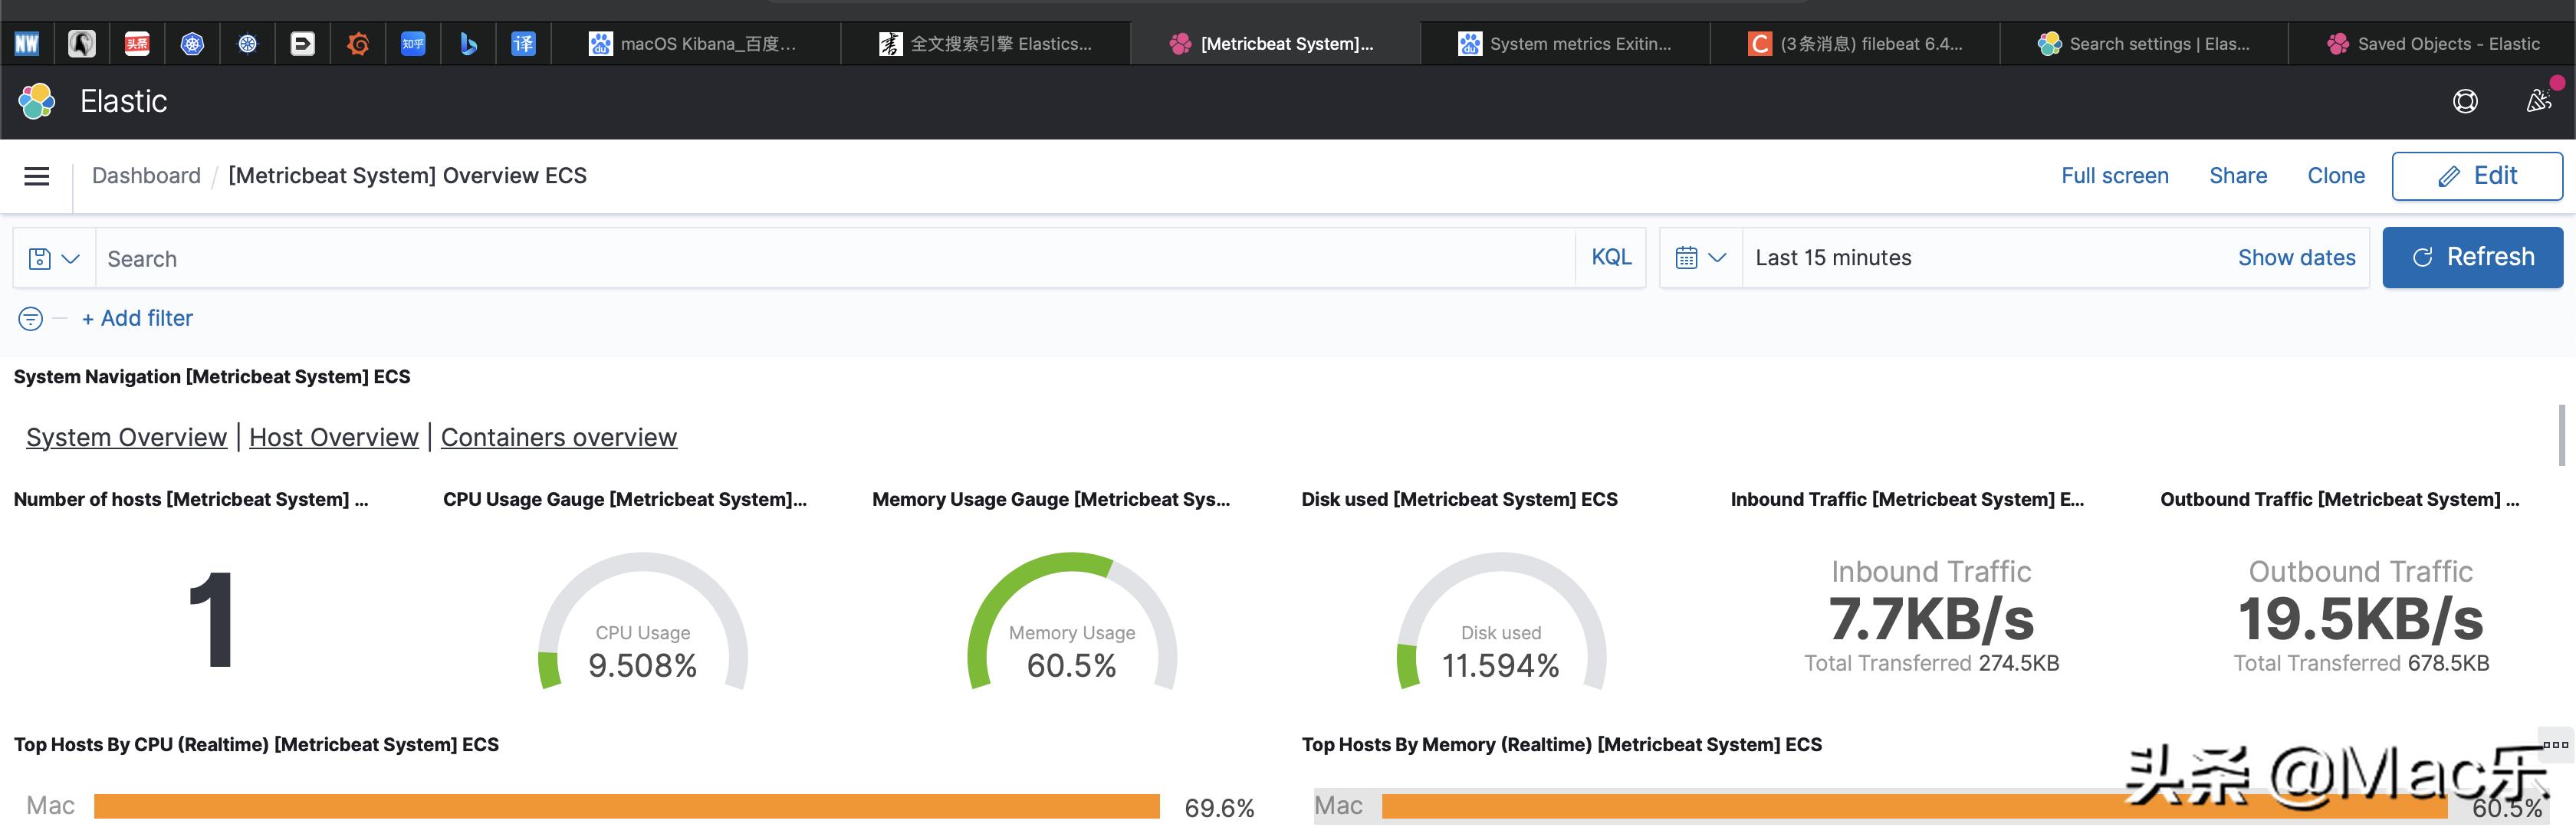
看下效果图。
这个也就是理解下概念。具体模块功能和怎么实现。