Understanding Markets and Customers 了解市场和客户
The Value of Research 研究的价值
Marketing research is the process of gathering data about the product, customers and influences on the sales of the product. It then analyses the data to help make decisions. 营销研究是收集有关产品、客户和产品销售影响因素的数据的过程。然后,它对数据进行分析,以帮助做出决策。

Good research 好的研究:
- Reduces the risk of making a poor decision. 减少了做出错误决定的风险。
- Helps businesses reach customers before their rivals. 帮助企业在对手之前接触到客户。
- Helps a market-led business identify their customers’ needs. 帮助以市场为导向的企业确定其客户的需求。
But 但是:
- Research takes time and resources. 研究需要时间和资源。
- It also depends on how well it’s interpreted. 这也取决于对它的解释有多好。
- Plus, conditions might change from the time that the research is done to the moment the product is on the market. 另外,从研究完成到产品上市的那一刻,情况可能会发生变化。
Primary Research 初级研究
Fresh research carried out specifically for the business, either by the business or by an external source. 专门为企业进行的新鲜研究,由企业或外部来源进行
Examples of primary market research are 初级市场研究的例子有:
- Surveys/questionnaires 调查/问卷
- Focus groups 焦点小组
- Observations 观察
Pros 优点
- Specific to the business. 具体到业务
- Meets precise needs of the business. 满足企业的精确需求
- Can discover information that no other business has access to. 可以发现其他企业无法获得的信息
Cons 缺点
- Needs specialist knowledge to set up and carry out. 需要专业知识来建立和实施
- Can be expensive. 可能很昂贵
- Often time-consuming. 通常很耗时
- May not be comprehensive enough to make an informed decision – not enough information. 可能不够全面,无法做出明智的决定--信息不足
Secondary Research 二级研究
Research which uses data that has already been collected. 使用已经收集的数据的研究
Pros 优点
- Cheaper. 更便宜
- Quick to access. 快速访问
Cons 缺点
- Not always in the format that the business wants. 并非总是以企业想要的形式出现
- Available to competitors. 可供竞争对手使用
- May only partially answer the specific questions. 可能只能部分回答具体问题。
Using Research 使用研究
The research can gather either quantitative or qualitative data 研究可以收集定量或定性的数据.
- Quantitative data 定量数据: numbers, like how many customers prefer one product over another. 数字,比如有多少顾客喜欢一种产品而不是另一种。
- Qualitative data 定性数据 : opinions and motives, like why the customers prefer the product. 意见和动机,如顾客为什么喜欢该产品。
Businesses like to use both because 企业喜欢使用这两种数据,因为:
- Quantitative data can be analysed and put into models. It’s also key for helping to put together budgets and proposals. Comparing figures is easier than comparing opinions. 定量数据可以被分析并放入模型中。它也是帮助编制预算和提案的关键。比较数字比比较意见更容易。
- Qualitative data can give an insight into the product or business which isn’t quantifiable. 定性数据可以提供对产品或业务的洞察力,而这是无法量化的。
Calculations 计算方式


Market Research 市场研究 v Marketing Research 营销研究
Market research looks at data within a specific market, like market size or competition. 市场研究着眼于特定市场内的数据,如市场规模或竞争。
Marketing research looks at data that will be used to influence the marketing. Therefore, market research is part of marketing research. 市场研究着眼于将用于影响营销的数据。因此,市场研究是营销研究的一部分。
Market Mapping 市场图谱
Market mapping illustrates the position of products relative to other products in the market. 市场绘图说明了产品在市场上相对于其他产品的位置。
It takes two criteria, each with a range. For example, price (high/low), age of customers (young/old), features of product (hi-tech/low-tech). 它需要两个标准,每个标准都有一个范围。例如,价格(高/低),客户的年龄(年轻/老),产品的特点(高科技/低科技)。
Businesses use market mapping to 企业利用市场图谱来:
- Assess product position to help make decisions on the direction of their marketing mix. 评估产品定位,以帮助决定其营销组合的方向。
- Assess how to adjust other strategies, for example operational management of quality. 评估如何调整其他战略,例如质量的运营管理。
- Essentially to see how to beat the competition to gain more sales. 从本质上讲,是为了了解如何击败竞争对手以获得更多的销售。
Value of Sampling 抽样调查的价值
Sampling is gathering data and opinions from a small section of a total group. It saves time and money by only asking, say, 1% of the total group, as long as the sample is thought to represent the opinions of the whole group. 抽样调查是从整个群体中的一小部分人那里收集数据和意见。只要样本被认为能代表整个群体的意见,只需询问,比如,总群体的1%,就可以节省时间和金钱。
Examples of sampling are 抽样的例子有:
- __Quota 定额 __– a specific number of a certain definable group to be asked. E.g. 100 people who wear glasses. Might then be stratified. 要询问某个可定义的群体的特定数量。例如,100个戴眼镜的人。然后可能会分层。
- Random 随机 – any person has an equal chance of being asked. 任何一个人都有平等的机会被询问。
- Stratified 分层 – certain percentages assigned to groups within the total group are asked. E.g. 50% males, 20% under the age of 18, 40% between 18 and 50, 40% over 50. 在整个群体中按一定比例分配的群体被询问。例如,50%为男性,20%在18岁以下,40%在18至50岁之间,40%在50岁以上。
Advantages of sampling 采样的优点
- Saves time. A quicker answer can lead to a product being launched or adjusted before the competition makes their move. 节省时间。更快的答案可以使产品在竞争者采取行动之前就被推出或调整。
- Saves money by not going through the process of asking the whole the group, which may be impractical anyway. 省钱,因为不需要询问整个团队,而这可能是不切实际的。
But 但是
- Might be biased – the questions might be incorrectly formulated or not be collated properly. 可能会有偏见--问题可能制定得不正确,或者没有经过适当的整理。
- Sample size might be too small. 样本量可能太小。
The Interpretation of Marketing Data 营销数据的解释
Businesses interpret marketing data by looking for trends, connections, patterns and gaps. 企业通过寻找趋势、联系、模式和差距来解释营销数据。
Correlation 相关性
Correlation analysis sees if there is a connection between two sets of information. 相关性分析看两组信息之间是否存在联系。
A positive correlation shows that an increase in the size of one factor links to an increase in the size of another. For example, an increase in spending on advertising might lead to an increase in sales. 正相关表明,一个因素规模的增加与另一个因素规模的增加有关。例如,广告支出的增加可能会导致销售的增加。
A negative correlation shows that a decrease in the size of one factor links to an increase in the size of another. For example, a decrease in price might lead to an increase in sales. 负相关表明,一个因素规模的减少与另一个因素规模的增加有关。例如,价格的下降可能导致销售的增加。
The stronger the relationship the further the correlation coefficient (the number generated by the analysis is away from__ 0 and closer to __1 关系越强,相关系数(由分析产生的数字远离__0,接近__1)就越远。
-1 Perfect negative correlation 完全的负相关
0 no correlation 没有相关关系
1 Perfect positive correlation 完全正相关
However, it doesn’t mean there’s a cause and effect. In other words, the figures might not be linked, just increase (or decrease) at the same time by chance. It might be that the change in one has a very small effect, but something else not examined has had the major effect. For example, sales might increase because advertising has increased, but in fact might mainly be because a competitor has left the market. 然而,这并不意味着有因果关系。换句话说,这些数字可能没有联系,只是偶然地在同一时间增加(或减少)。可能是其中一项的变化产生了非常小的影响,但其他未被检查的东西却产生了主要影响。例如,销售量的增加可能是因为广告的增加,但事实上可能主要是因为一个竞争对手离开了市场。
Confidence Levels 信心水平
Confidence levels are used to decide how representative the researchers believe the data to be. 信心水平是用来决定研究人员认为数据的代表性。
For example, if they estimate future sales to be between £12m and £13m in the next quarter, and they are 95% confident of that, then they think 19 out of 20 times, this will be the case. If they made the estimate narrower, say between £12.4m and £12.7m, then the confidence level might be 80%. 例如,如果他们估计下一季度的未来销售额在1200万到1300万英镑之间,而且他们对此有95%的信心,那么他们认为20次中有19次会是这种情况。如果他们把估计的范围缩小,例如在1240万英镑和1270万英镑之间,那么信心水平可能是80%。
Extrapolation 外推法
Extrapolation is a method of predicting a possible future value. It’s done by looking at past trends and then estimating the outcome if that trend continues in the future. 外推法是一种预测未来可能价值的方法。它是通过观察过去的趋势,然后估计如果该趋势在未来继续下去的结果。
The Value of Technology in Gathering and Analysing Data for Marketing Decision Making 技术在为营销决策收集和分析数据方面的价值
Technology helps to gather and analyse data more effectively 技术有助于更有效地收集和分析数据:
- Social media 社交媒体 – a rich source of personal information and understanding brand awareness. It’s easier and quicker to reach certain target markets. 是个人信息和了解品牌意识的丰富来源。更加容易和快速地接触到某些目标市场。
- Data collection 数据收集 – using software to ask more people more questions. Plus, every sale can be electronically recorded to understand buying patterns. 利用软件向更多人提出更多问题。另外,每笔销售都可以用电子方式记录下来,了解购买模式。
- __Enhanced data analysis 增强的数据分析 __– more sophisticated and faster data analysis. It allows businesses to understand their customers more fully. 更复杂、更快速的数据分析。它使企业能够更全面地了解他们的客户。
- __Larger pool of data 更大的数据库 __– that can be sifted through more quickly, giving more confidence in the potential outcomes. 可以更快筛选,对潜在结果更有信心。
Examples of technology being used 正在使用的技术的例子:
- Mobile phone companies checking data usage by current customers to change their tariff packages. 移动电话公司检查现有客户的数据使用情况,以改变他们的资费套餐。
- Amazon looking at items searched on their site to see which products to promote. 亚马逊查看在其网站上搜索的项目,以了解哪些产品需要推广。
The Interpretation of Price and Income Elasticity of Demand Data 价格和收入需求弹性数据的解释
Elasticity means how sensitive something is to a change. 弹性意味着某物对变化的敏感程度
Price elasticity of the demand describes how sensitive demand for a product is to a change in the price of that product. 需求的价格弹性描述了对一种产品的需求对该产品价格变化的敏感程度
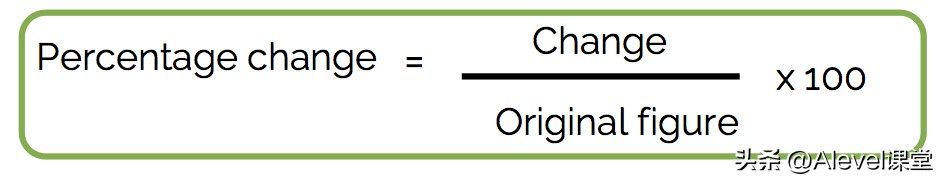
It’s calculated by 它的计算方法是:
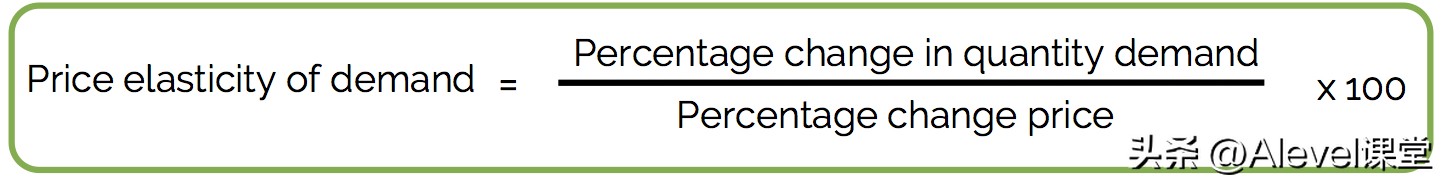
Percentage change is worked out by 变化的百分比是通过计算得出的:
The result is always negative 其结果总是负的.
Interpreting thePEDresult 解释PED的结果
If the result is between -1 __and __0 , it’s inelastic. 如果结果在-1 __和__0之间,它是无弹性的。
If the result is between –infinity and__ -1__, it’s elastic. 如果结果在-无穷大和__-1__之间,它是有弹性的。
The more elastic, the closer the number is to – infinity. 弹性越大,数字就越接近-无穷大。
If the product is elastic, then a fall in price will increase sales revenue. 如果产品是有弹性的,那么价格的下降将增加销售收入。
If the product is inelastic, then an increase in price will increase sales revenue. 如果产品是无弹性的,那么价格的上升将增加销售收入。
It’s guaranteed that you will use this concept in the exam at some stage__. __Think whether the product that the business is selling is elastic or inelastic. 保证你在考试中的某个阶段会用到这个概念__。思考企业销售的产品是有弹性还是无弹性。
Influences and limitations for PED 对PED的影响和限制
The elasticity of demand is made more inelastic 需求的弹性变得更加缺乏弹性:
- If the product has a strong brand image 如果产品有一个强大的品牌形象
- If the product is low percentage of a typical customer’s income 如果产品在典型客户的收入中所占比例较低
- If a customer takes less time to choose the product 如果顾客选择产品所需的时间较短
- If there are few close substitutes for the product. 如果该产品的近似替代品很少
Or BITS (brand, income, time, substitutes 品牌、收入、时间、替代品)
PED has limitations because it is very difficult for a business to work out a product’s __PED __since it’s unlikely to change the price too often. It also won’t be able to work out whether any changes in demand have been caused by changes in the price, or by other factors, like changes in customers’ tastes or prices of substitute products. PED有局限性,因为企业很难计算出产品的__PED__,因为它不可能经常改变价格。它也无法计算出需求的任何变化是由价格的变化造成的,还是由其他因素造成的,如顾客口味的变化或替代产品的价格。
Calculating income elasticity of demand 计算需求的收入弹性
Income elasticity of demand describes how sensitive demand for a product is to a change in the income of a typical customer 需求的收入弹性描述了对产品的需求对典型客户的收入变化的敏感程度。
It’s calculated by 它的计算方法是:
If the figure is less than 0 , then it’s known as an inferior good. In other words, as customers earn more money, they will stop buying this product and move to higher quality products. 如果这个数字小于0,那么它就被称为劣质商品。换句话说,随着顾客收入的增加,他们会停止购买这种产品而转向更高质量的产品。
If the figure is between 0 and__ 1__, it’s an inelastic good, less sensitive to changes in incomes. 如果这个数字在0和__1__之间,它就是一种无弹性的商品,对收入的变化不太敏感。
If the figure is above 1 , it’s an elastic good, so more sensitive to changes in incomes. 如果数字高于1,它就是一种弹性商品,所以对收入的变化更敏感。
It’s almost impossible for firms to calculate their income elasticity of demand. However, it can give an indication of whether the product will do well in the current economic climate. 企业几乎不可能计算出他们的收入需求弹性。然而,它可以说明产品在当前的经济环境中是否会有好的表现。
The Value of the Concepts of Price and Income Elasticity of Demand in Marketing Decision Making 价格和收入需求弹性的概念在营销决策中的价值
Price elasticity of demand 需求的价格弹性:
- Pricing decisions 定价决策 – for example, a business might increase the price of more inelastic products. 例如,企业可能会提高较无弹性产品的价格
- Output decisions 产量决策 – plan how much to increase output if dropping the price. 计划如果降价,要增加多少产量。
- Marketing mix decisions to make it more price inelastic, for example through an advertising campaign. 营销组合决策,使其更加没有价格弹性,例如通过广告活动。
Income elasticity of demand 需求的收入弹性
It has very limited value because it’s almost impossible to calculate. However, if you consider or feel instintively that your good is income elastic or inferior, you could be looking at the government data on future incomes to decide on production decisions or launching or developing new products. 它的价值非常有限,因为它几乎不可能计算出来。然而,如果你认为或本能地感觉到你的商品具有收入弹性或劣势,你可以看政府关于未来收入的数据来决定生产决策或推出或开发新产品。
The Use of Data in Marketing Decision Making and Planning 数据在营销决策和规划中的应用
Good data is accurate and up-to-date. It helps make better decisions. 好的数据是准确和最新的。它有助于做出更好的决策。
It’s part of the scientific decision-making model 它是科学决策模式的一部分
Set objectives – gather data – analyse data – select – implement – review. 设定目标-收集数据-分析数据-选择-实施-审查
However, the business needs to take into account non-quantifiable ideas, such as customers’ feelings and a sense of where the market might be going (growth or innovations, for example). 然而,企业需要考虑到非量化的想法,如客户的感受和对市场可能走向的感觉(例如,增长或创新)
Definitions 定义
|
Primary research 初级研究 |
First-hand research, gathering information directly from consumers 第一手研究,直接从消费者那里收集信息 |
|
Secondary research 二级研究 |
Research that has already been carried out or published by another firm 另一家公司已经进行的或发表的研究 |
|
Sampling 抽样调查 |
Sampling is the process of taking and analysing a smaller group of a whole population 抽样是指从整个人口中抽取一个较小的群体并进行分析的过程 |
|
Quantitative data 量化数据 |
Research based on numbers 基于数字的研究 |
|
Qualitative data 定性数据 |
Research based on opinions and attitudes 基于意见和态度的研究 |
|
Market mapping 市场分布图 |
A grid that shows two different aspects of the products or brands within a market 显示一个市场内产品或品牌的两个不同方面的网格 |
|
Correlation 相关性 |
How closely related two sets of data are 两组数据的关系有多密切 |
|
Confidence levels 信心水平 |
The degree to which the statistics are a reliable predictor of an outcome 统计数据对结果的可靠预测程度 |
|
Extrapolation 外推法 |
Predicting future values based on past data 根据过去的数据来预测未来的价值 |
|
Price elasticity of demand 需求的价格弹性 |
The responsiveness of a change in demand of a product to a change in price 一个产品的需求变化对价格变化的反应能力。 |
|
Income elasticity of demand 需求的收入弹性 |
The responsiveness of a change in demand of a product to a change in income 产品需求的变化对收入变化的反应 |