SPSS统计分析(五)初识统计量✦
SPSS Statistical Analysis (5) Preliminary Knowledge of Statistics

描述性统计量是指变量某一特征的统计量,SPSS提供的基本统计量大致可以分为3类:描述集中趋势的统计量、描述离散程度的统计量和描述总体分布形态的统计量。
Descriptive statistics refer to the statistics of a certain feature of a variable. The basic statistics provided by SPSS can be roughly divided into three categories: statistics describing the central tendency, statistics describing the degree of dispersion, and statistics describing the overall distribution pattern.
描述集中趋势的统计量✦
statistics describing the central tendency
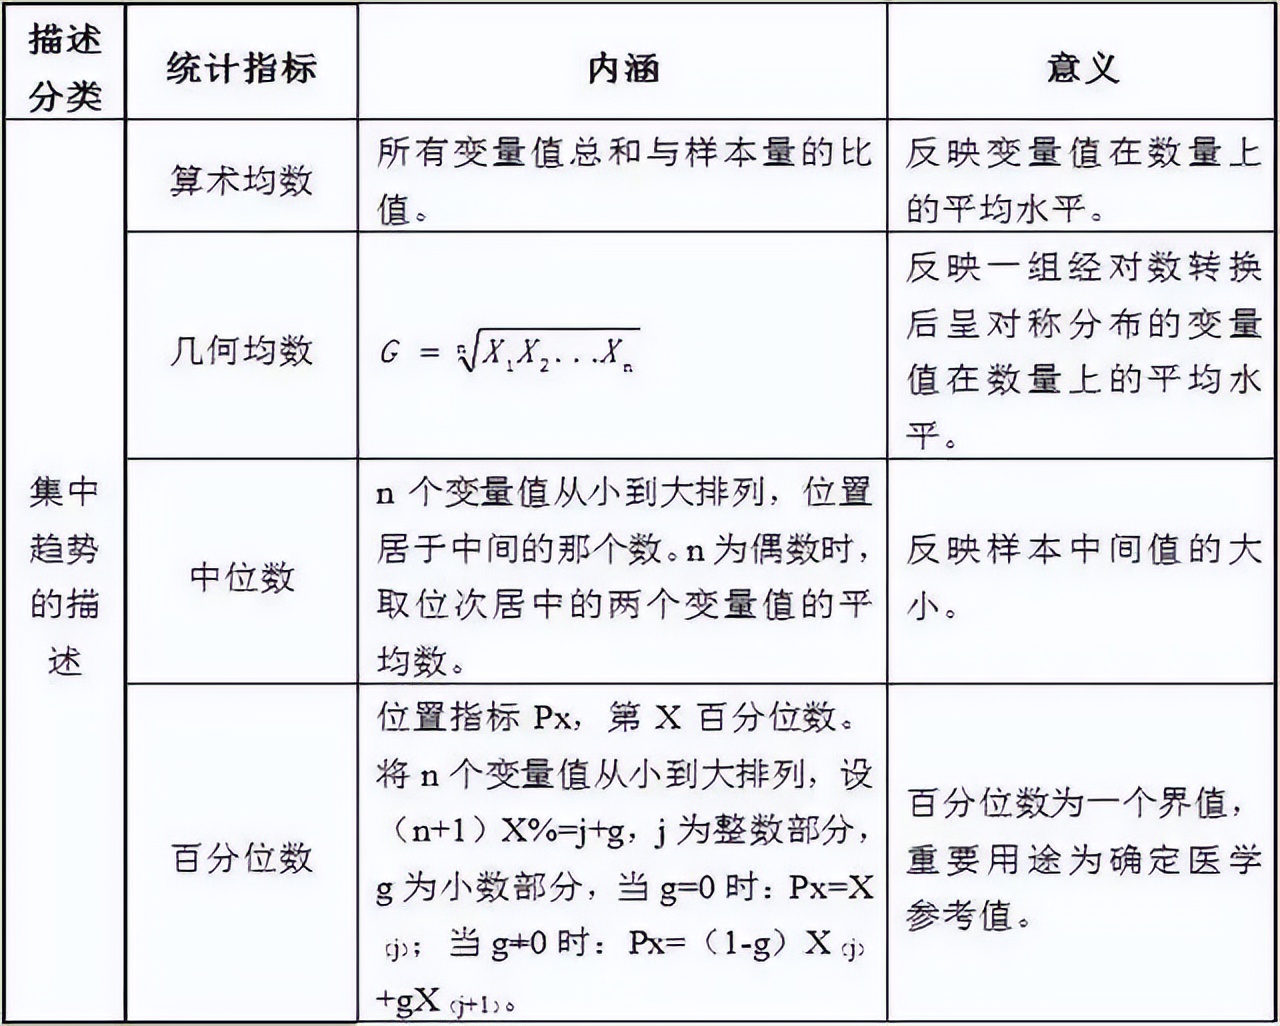
其中,集中趋势是指一组数据向某一中心值靠拢的倾向与程度,那么计算描述集中趋势的统计量就是要找到能够反映数据一般水平的代表值或者是中心值。常用的集中趋势统计量包括均值、中位数、众数、总和及百分位数等。
Among them, the central tendency refers to the tendency and degree of a set of data to move towards a certain central value, then the calculation of the statistics describing the central tendency is to find a representative value or central value that can reflect the general level of the data. Commonly used central tendency statistics include mean, median, mode, sum, and percentiles.
描述离散程度的统计量✦
statistics describing the degree of dispersion
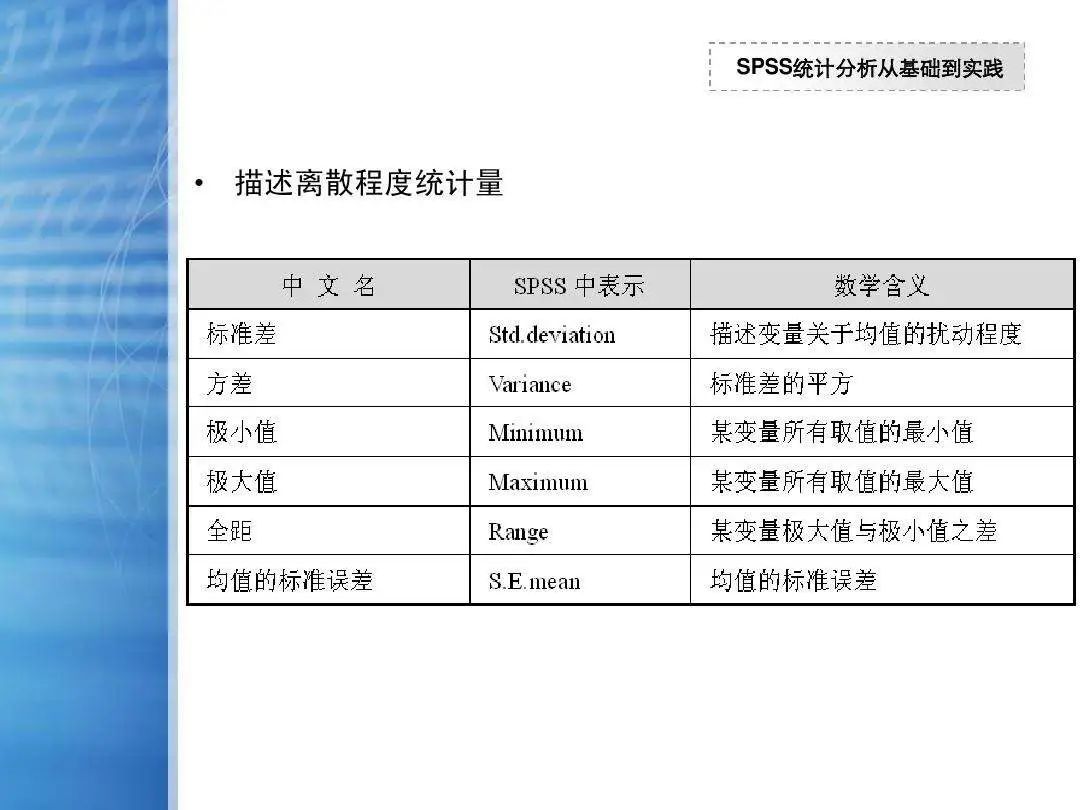
离散程度是指一组数据远离其“中心值”的程度,统计学中描述离散程度的统计量是样本值远离集中趋势统计量程度的定量化描述,比较重要的描述离散程度的统计量有样本方差、样本标准差、均值标准误差、极差等。
The degree of dispersion refers to the degree to which a set of data is far away from its "central value". The statistic describing the degree of dispersion in statistics is a quantitative description of the degree to which the sample value is far away from the central tendency statistic. The more important statistics describing the degree of dispersion have samples. Variance, sample standard deviation, mean standard error, range, etc.
描述数据分布形态的统计量 ✦
statistics describing the overall distribution pattern
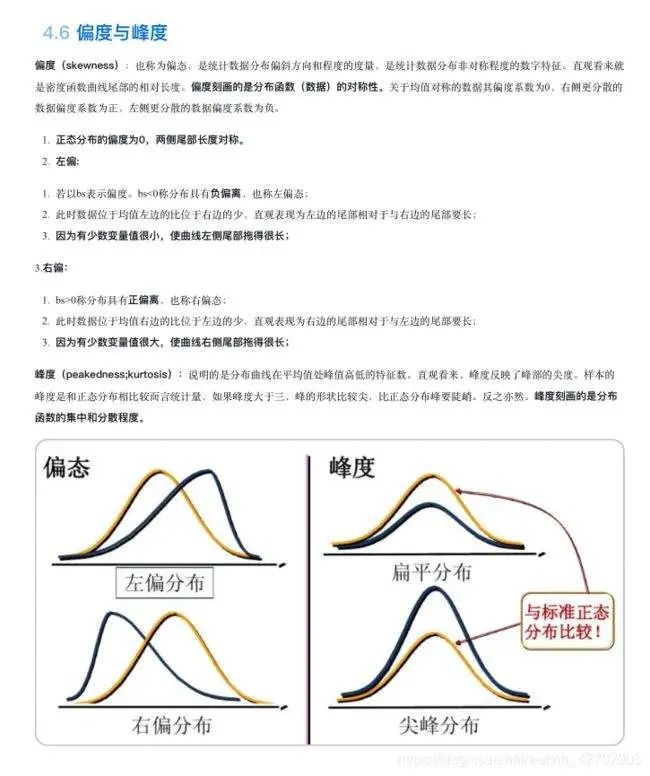
集中趋势和离散程度是数据分布的重要特征,但要从整体上全面把握样本数据的分布,仅有集中趋势和离散程度统计量是不够的,还要掌握数据分布的形态,例如直方图的对称性、偏斜程度以及陡缓程度等。描述数据分布形态的统计量主要有偏度和峰度两种。
Central tendency and degree of dispersion are important characteristics of data distribution, but to fully grasp the distribution of sample data as a whole, only the statistics of central tendency and degree of dispersion are not enough, but also the shape of data distribution, such as the symmetry of histogram , the degree of skewness, and the degree of steepness. There are two main types of statistics that describe the shape of data distribution: skewness and kurtosis.
参考资料:百度百科,《SPSS 23统计分析实用教程》
翻译:谷歌翻译
本文由LearningYard新学苑原创,部分文字图片来源于他处,如有侵权,请联系删除。