目录
1、项目背景
2、项目主要应用技术
3、项目数据
4、项目过程
4.1、导库
4.2、数据读取
4.3、数据探索
4.4、数据预处理
4.4.1、重复值处理
4.4.2、异常值处理
4.4.3、缺失值处理
4.4.4、特征构造
4.5、特征工程
4.5.1、特征相关性分析
4.5.2、目标相关性分析
4.6、模型搭建
4.6.1、构建特征值和目标值
4.6.2、划分训练和测试集
4.6.3、模型搭建
4.7、模型评估
4.8、模型预测及可视化
4.9、特征重要性分析
4.10、模型保存
4.11、模型部署
4.12、接口测试
一、项目背景:
客流预测是城市轨道交通规划设计和运营管理的基本依据,已成为城市轨道交通建设过程中的重要环节。随着我国城市轨道交通路网的不断完善,城市轨道交通客流预测的重要性也越来越明显。本项目对城市轨道交通客流的统计特征及客流组合预测方法进行了研究,通过对城市轨道交通客流历史数据进行统计分析,得出轨道交通客流的基本统计特征。主要表现为:节假日客流的统计特征与平常日客流明显不同且不同节假日客流具有不同的统计特征;平常日客流具有一定的非线性和非平稳性,并且以周为时间单位不断波动;通过对轨道交通客流进行聚类分析,可以将平常日客流分为工作日客流和周末客流两大类。
客流研究的方向有很多,本项目主要围绕平常日客流展开分析。
二、项目主要应用技术
本项目用到的主要技术包括:
- 数据科学:numpy,pandas
- 画图:matplotlib,seaborn
- 数据建模:sklearn
- 算法:DecisionTreeRegressor,RandomForestRegressor,LogisticRegression,LinearRegression,Ridge,Lasso
- 集成算法:xgboost,catboost,AdaBoostRegressor,GradientBoostingRegressor
- 模型保存:joblib
- 模型部署:flask
- 另外测试工具用的 RESTClient 。
三、项目数据
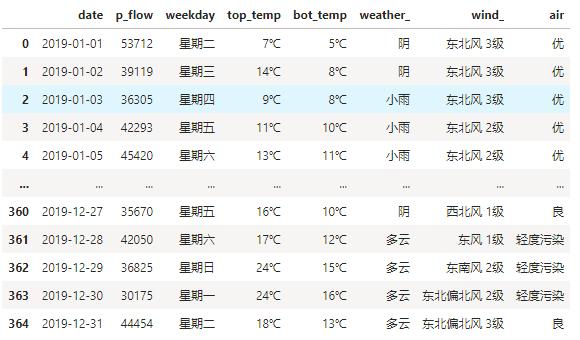
客流数据:
date : 日期
p_flow : 客流
天气数据采集:
date : 日期
weekday : 星期
top_temp : 最高温
bot_temp : 最低温
weather_ : 天气
wind_ : 风速
air : 空气质量
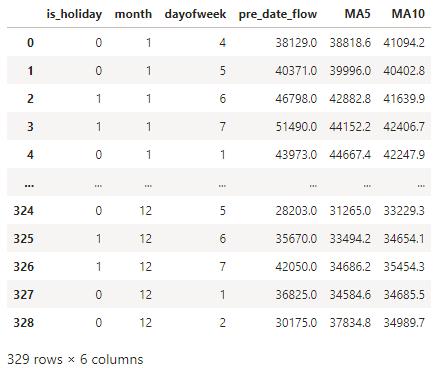
构建数据:
is_holiday : 是否节假日(1表示节假日,0表示工作日)
month :当前日期所属月份
dayofweek :当前日期所属星期pre_date_flow : 前一天的客流
MA5 : 前5日移动平均客流
MA10 : 前10日移动平均客流
研究对象:
p_flow : 客流
四、项目过程
4.1、导库:
# 数据科学
import numpy as np
import pandas as pd
# 画图相关
import matplotlib.pyplot as plt
import seaborn as sns
plt.rcParams['font.family']='SimHei' # 中文乱码
plt.rcParams['axes.unicode_minus']=False # 负号无法正常显示
%config InlineBackend.figure_format='svg' # 像素清晰
from scipy.cluster.hierarchy import linkage, dendrogram # 绘制树状图像
# 忽略警告
import warnings
warnings.filterwarnings('ignore')
# 特征选择
from sklearn.preprocessing import LabelEncoder, MinMaxScaler, StandardScaler, OrdinalEncoder, OneHotEncoder
# 特征工程
from sklearn.decomposition import PCA
from sklearn.model_selection import train_test_split
# 分类模型
from sklearn.tree import DecisionTreeClassifier
from sklearn.ensemble import RandomForestClassifier
from sklearn.svm import LinearSVC
from sklearn.naive_bayes import BernoulliNB # 伯努利贝叶斯
# 回归模型
from sklearn.tree import DecisionTreeRegressor
from sklearn.ensemble import RandomForestRegressor
from sklearn.linear_model import LogisticRegression # 一元线性回归模型
from sklearn.linear_model import LinearRegression
from sklearn.linear_model import Ridge # 岭回归
from sklearn.linear_model import Lasso
# 集成算法
from xgboost import XGBRegressor
from catboost import CatBoostRegressor
from sklearn.ensemble import AdaBoostRegressor
from sklearn.ensemble import GradientBoostingRegressor
# 模型评估
from sklearn.metrics import recall_score, precision_score, roc_auc_score, accuracy_score
4.2、数据读取:
df = pd.read_csv(r'E:\Files\公司业务\pkπ\2020-05\nanning_line1.csv', encoding='utf-8', parse_dates=['date'])
weather = pd.read_csv(r'E:\Files\公司业务\pkπ\2020-06\nanning_weather.csv', encoding='gbk',parse_dates=['date'])
这里的数据读取的是公司在某城市1号线项目1年的真实客流数据,读取之后放到了df中。而天气数据是爬取的网上的天气网站的19年某城市的历史天气数据。
4.3、数据探索
数据形状:
df.shape

显示客流数据有365行,2列。
weather.shape

显示天气数据有365行,7列。
数据类型:
df.info()
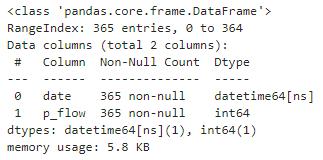
显示有365行不为空的客流数据。
weather.info()

显示有365行不为空的天气数据。
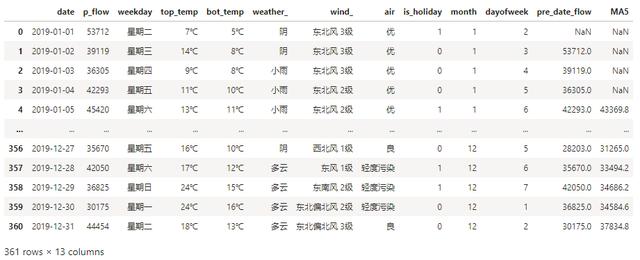
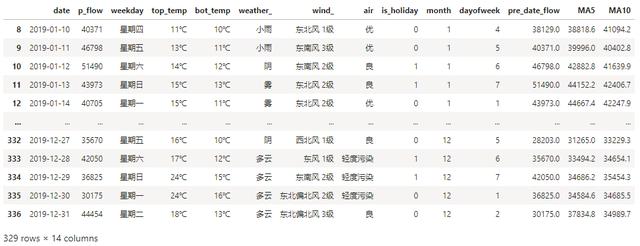
查看前几行:
df.head()

客流数据的前几行。
weather.head()
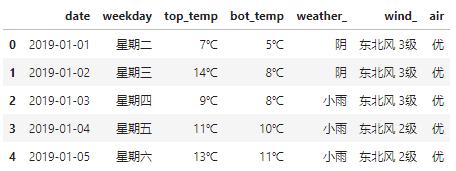
天气数据的前几行。数据概览:
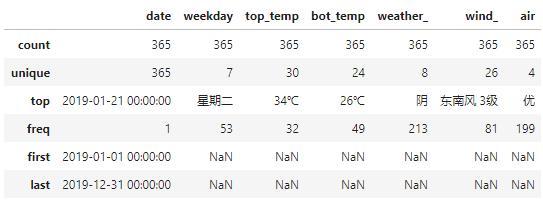
df.describe()

weather.describe()
数据合并:
df = pd.merge(df,weather,on='date')
4.4、数据预处理
4.4.1、重复值处理:查看重复值:
df[df.duplicated()]

显示无重复数据。
查看重复数量:
df.duplicated().sum()

查看重复数据进行确认,结果是0,缺失无重复数据。
4.4.2、异常值处理
查看数据分布:让我们来查看一下1年当中数据的分布:
plt.figure(figsize=(15,5))
plt.plot(df.iloc[:,0],df.iloc[:,1]/10000, label='XX1号线')
plt.legend()
plt.show()
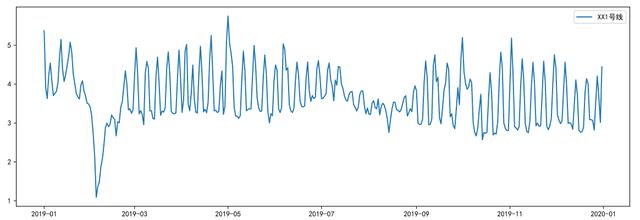
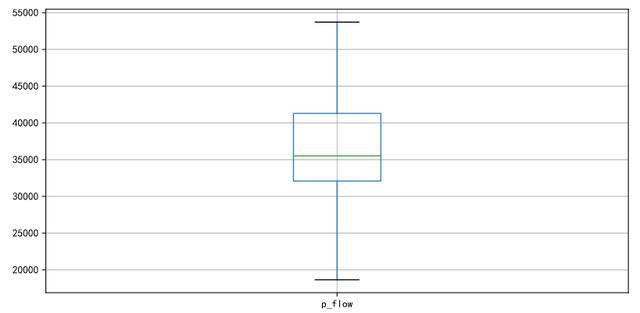
从图中我们可以看出,1年的日客流数据存在节假日客流和非节假日客流之分。节假日客流的统计特征与平常日客流明显不同且不同节假日客流具有不同的统计特征,例如春节期间,客流是明显下降的,而五一,十一期间数据陡增;平常日客流具有一定的非线性和非平稳性,并且以周为时间单位不断波动。我们来看看异常值。查看异常值:
plt.figure(figsize=(10,5))
p = df.boxplot(return_type='dict') #画箱线图,直接使用DataFrame的方法
x = p['fliers'][0].get_xdata() # 'flies'即为异常值的标签
y = p['fliers'][0].get_ydata()
y.sort()
for i in range(len(x)):
if i>0:
plt.annotate(y[i], xy = (x[i],y[i]), xytext=(x[i]+0.05 -0.10/(y[i]-y[i-1]),y[i]))
else:
plt.annotate(y[i], xy = (x[i],y[i]), xytext=(x[i]+0.10,y[i]))
plt.show()
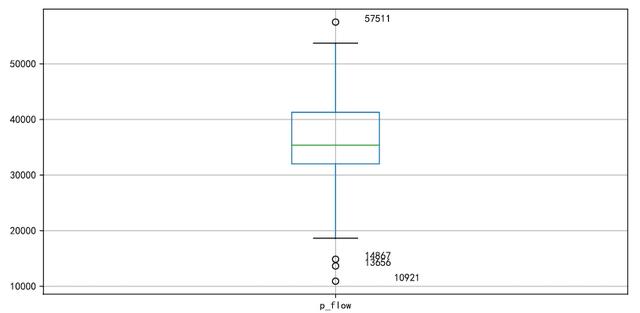
找出异常数据:
df[df['p_flow'].isin(y)]
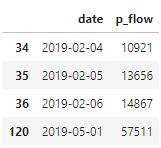
y = p['fliers'][0].get_ydata() , 返回的y就是异常值,用isin()函数判断DataFrame中是否存在特定的值;然后根据布尔索引,得到DataFrame中的异常值。删除异常值:
df.drop(df[df['p_flow'].isin(y)].index, inplace=True)
查看删除的效果,再执行一遍箱线图:
plt.figure(figsize=(10,5))
p = df.boxplot(return_type='dict') #画箱线图,直接使用DataFrame的方法
x = p['fliers'][0].get_xdata() # 'flies'即为异常值的标签
y = p['fliers'][0].get_ydata()
y.sort()
for i in range(len(x)):
if i>0:
plt.annotate(y[i], xy = (x[i],y[i]), xytext=(x[i]+0.05 -0.10/(y[i]-y[i-1]),y[i]))
else:
plt.annotate(y[i], xy = (x[i],y[i]), xytext=(x[i]+0.10,y[i]))
plt.show()
可以看到异常值已经清除完毕。
4.4.3、缺失值处理
df[df['flow'].isnull()]

提示数据中无缺失值。
4.4.4、特征构造
增加是否节假日:
df['is_holiday'] = df['date'].apply(lambda x: 1 if is_holiday(x)==True else 0 )
df.index = range(df.shape[0]) # 恢复索引

客流特征可能跟今天是否为节假日有关,节假日包括法定节日和周末。一般来说非工作日(周末和节假日)的客流和工作日的客流是有差异的,所以增加了这个特征。
增加月份:
df['month'] = df['date'].map(lambda x: x.month)

不同月份的客流可能会存在差异,故增加此特征进行探索。
增加星期:
df['dayofweek']=df['date'].dt.dayofweek +1 # +1 之后数字几就代表星期几
客流可能存在以星期为规律变换的现象,所以提取了星期作为特征之一。
增加前一天的数据:
df['pre_date_flow'] = df.loc[:,['p_flow']].shift(1)
作为时间序列问题,前一天的客流和今天的客流可能是存在某种关系的。比如前一天是第一天开始放假,客流下降,那么今天的客流也大概率是下降的。这里用了 shift()函数来对数据进行平移,参数1表示平移1个单位,取昨天的数据。如果是-1就表示平移到下一个单位,取当前时间的第二天数据。

5日移动平均:
df['MA5'] = df['p_flow'].rolling(5).mean()
同样考虑时间序列问题,前5天的平均客流也是会对今天的客流数据产生影响。故增加此特征。
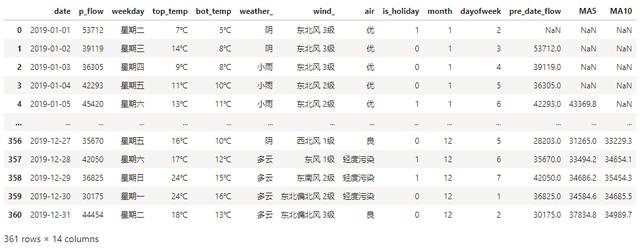
10日移动平均:
df['MA10'] = df['p_flow'].rolling(10).mean()
同理增加10日移动平均客流。
删除节假日:
holiday_list =[ '2019-01-01'
,'2019-02-04','2019-02-05','2019-02-06','2019-02-07','2019-02-08','2019-02-09','2019-02-10'
,'2019-04-05','2019-04-06','2019-04-07'
,'2019-05-01','2019-05-02','2019-05-03','2019-05-04'
,'2019-06-07','2019-06-08','2019-06-09'
,'2019-09-13','2019-09-14','2019-09-15'
,'2019-10-01','2019-10-02','2019-10-03','2019-10-04','2019-10-05','2019-10-06','2019-10-07'
]
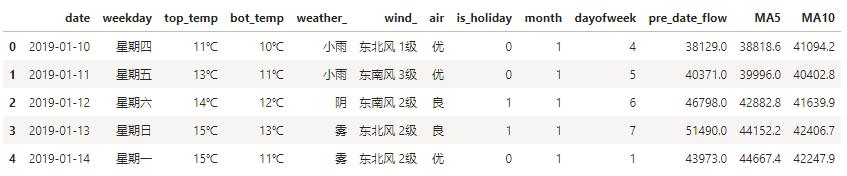
df = df[df['date'].isin(holiday_list) == False]
df.index = range(df.shape[0])
df.head()
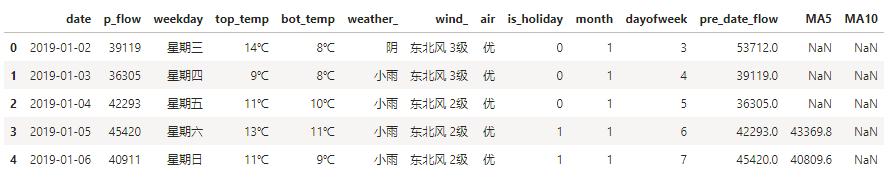
节假日对于日常规律的客流数据而言,是异常值,所以进行删除。
删除缺失值:
df.dropna(inplace=True)
4.5、特征工程
4.5.1、特征相关性分析获取所有特征变量:
feature = df.drop(['p_flow'],axis=1)
特征之间的相关性,得到相关性矩阵:
corr = feature.corr()

特征矩阵进行热力图可视化展示:
plt.figure(figsize=(10,6))
ax = sns.heatmap(corr, xticklabels=corr.columns,
yticklabels=corr.columns, linewidths=0.2, cmap="RdYlGn",annot=True)
plt.title("Correlation between variables")
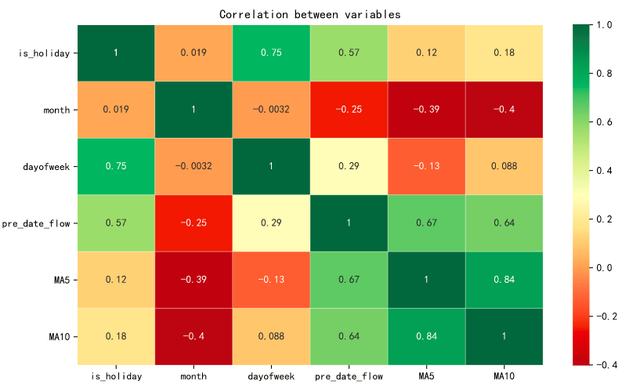
特征相关性分析,是为了查看特征之间是否存在多重共线性,如果有多重共线性的话,就要对相关性特别高的特征进行有选择的删除。从热力图的结果来看,MA5和MA10的相关性是最高的,但也可以接受,不需要对特征进行删除。
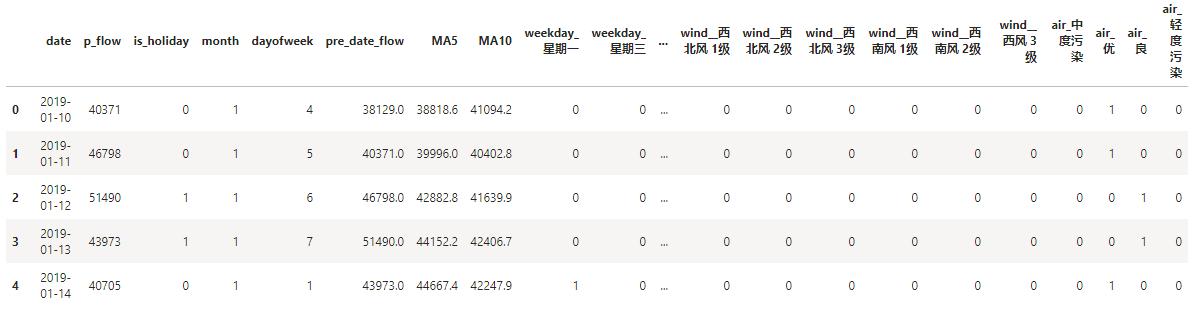
4.5.2、目标相关性分析
df_onehot = pd.get_dummies(df)
df_onehot.head()
可视化展示:
plt.figure(figsize=(20,4))
df_onehot.corr()['p_flow'].sort_values(ascending=False).plot(kind='bar')
plt.title('Correlation between p_flow and variables')

分析: 从上图中我们可以看出:1、客流和前一天的客流(pre_date_flow), 是否为节假日(is_holiday), 周期(dayofweek), 前10日平均客流(MA10),前5日平均客流(MA5) 是有相关性的,并且是正相关。
2、从天气情况来看,客流和低温(top_temp_12C),大风 (wind_东南风5级) , 高温(top_temp_35C),成正相关。和舒服的气温(weather晴天),舒适的温度(bot_temp_23C),成负相关。说明恶劣天气的时候,选择乘坐地铁的人比较多,而天气好的时候,大家出行的可选性比较多。
3、从星期来看,和星期五,星期六,星期日成正相关,和周一,周二,周三,周四成负相关。说明周末的客流数更多,而工作日的客流更少。由于我们取的数据是普通城市的客流数据,这个和一线城市的客流情况是不同的。我们下面来通过对星期进行聚类来验证。
# 按星期聚类
table = pd.pivot_table(df, index=['dayofweek'], values=['p_flow'], aggfunc='sum') # 对数据进行聚合
plt.figure(figsize=(11,4))
Z = linkage(table, method='ward', metric='euclidean')
p = dendrogram(Z,0)
plt.xlabel("星期", fontsize=14)
plt.ylabel("欧式距离", fontsize=14)
plt.title("XX1号线星期聚类图", fontsize=16)
plt.show()
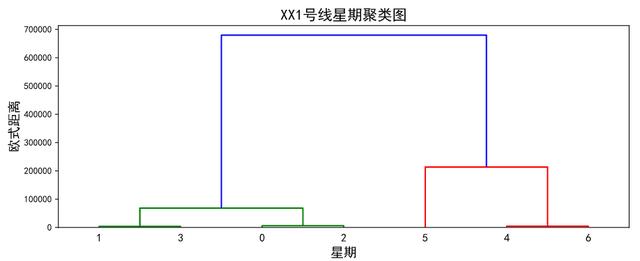
可以看出,周一,周二,周三,周四,是聚成一类,周五,周六,周日聚成一类。
4.6、模型搭建
4.6.1、构建特征值和目标值
# 构建特征值X 和目标值 Y
X = df[['is_holiday','month','dayofweek','pre_date_flow','MA5','MA10']]
y = df['p_flow']
X.index = range(X.shape[0])
4.6.2、划分训练集和测试集
X_length = X.shape[0]
split = int(X_length*0.9)
X_train, X_test = X[:split], X[split:]
y_train, y_test = y[:split], y[split:]
需要注意的是,这里的模型是一个时间序列问题,需要用前面的时间数据来预测后面的时间序列问题,故在此用前90%作为训练集,后10%作为测试集。而不能用train_test_split方法,对训练集和测试集进行随机划分。
4.6.3、模型搭建
# 回归算法
Regressors=[["Random Forest",RandomForestRegressor()]
,["Decision Tree",DecisionTreeRegressor()]
,["Lasso",Lasso()]
,["AdaBoostRegressor", AdaBoostRegressor()]
,["GradientBoostingRegressor", GradientBoostingRegressor()]
,["XGB", XGBRegressor()]
,["CatBoost", CatBoostRegressor(logging_level='Silent')]
]
reg_result=[]
names=[]
prediction=[]
for name,reg in Regressors:
reg = reg.fit(X_train, y_train)
y_pred=reg.predict(X_test)
#回归评估
mae = mean_absolute_error(y_test,y_pred)
mse = mean_squared_error(y_test,y_pred)
r2= r2_score(y_test,y_pred)
reg_result.append(class_eva)
name=pd.Series(name)
names.append(name)
y_pred=pd.Series(y_pred)
prediction.append(y_pred)
4.7、模型评估
names=pd.DataFrame(names)
names=names[0].tolist()
result=pd.concat(reg_result,axis=1)
result.columns=names
result.index=["mae","mse","r2"]
result
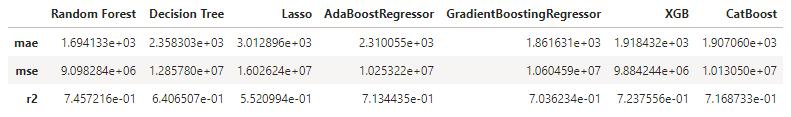
我们可以看到随机森林的r^2表现最好,mse均方误差也是最小,那么我们选择用随机森林进行预测。
4.8、模型预测及可视化:
rfc = RandomForestRegressor(n_estimators=50
,random_state=1
,bootstrap=True
,oob_score=True
)
rfc = rfc.fit(X_train, y_train)
y_pred = reg.predict(X_test)
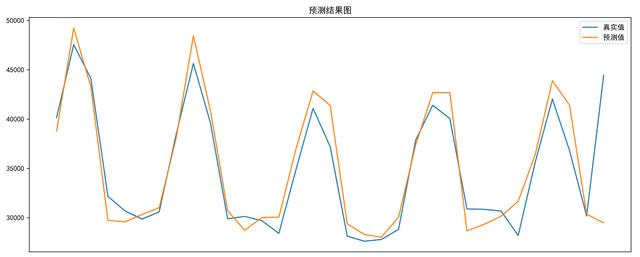
预测结果可视化:
plt.figure(figsize=(15,6))
plt.title('预测结果图')
plt.plot(y_test.ravel(),label='真实值')
plt.plot(y_pred,label='预测值')
plt.xticks([])
plt.legend()
plt.show()
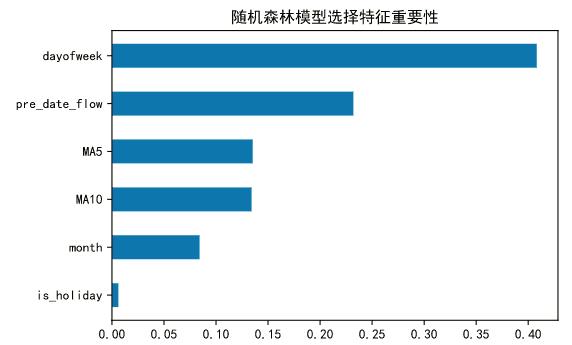
4.9、特征重要性分析
rfc.feature_importances_
features = X_train.columns
impor = pd.DataFrame([*zip(features, rfc.feature_importances_)])
impor.columns= ['feature', 'importance']
impor.sort_values(by='importance', inplace = True)
# 随机森林模型选择特征重要性
plt.barh(impor['feature'], height=0.5, width=impor['importance'])
plt.title("随机森林模型选择特征重要性")
plt.show()
4.10、模型保存:
import joblib
# 模型保存
joblib.dump(reg, 'keliu.pkl')
4.11、模型部署:
from flask import Flask,request,jsonify
import joblib
app = Flask(__name__)
# /keliu是路由地址,methods是支持http方法,可以分为POST和GET
@app.route('/keliu',methods=["POST"])
def keliu():
# 获得post传过来的数据
data = request.get_json(force=True)
model = joblib.load('keliu.pkl')
pro = model.predict(data)
info = {'result': str(pro)}
return jsonify(info)#返回结果
if __name__ == '__main__':
# host='0.0.0.0'是为了接口能被局域网中其他机器访问,port为端口号
app.run(host='0.0.0.0', port=8080)
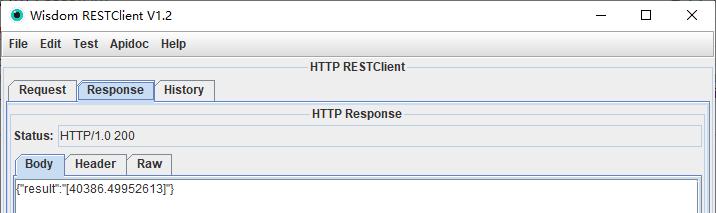
4.12、接口测试:接口调取
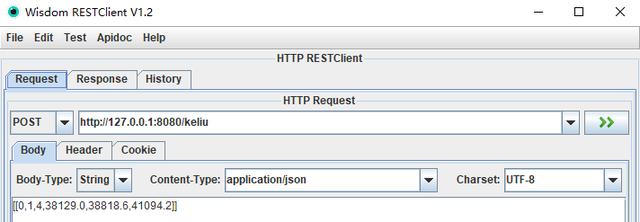
接口返回: