Yi Shuo School District (50) SPSS Statistical Analysis (60) Basic Cognition of Chart

“分享兴趣,传播快乐,增长见闻,留下美好!大家好,这里是小编。欢迎大家继续访问学苑内容,我们将竭诚为您带来更多更好的内容分享。
"Share interests, spread happiness, increase knowledge and leave beauty! Hello everyone, this is Xiaobian. Welcome to continue to visit the content of the academy, and we will bring you more and better content sharing wholeheartedly.
【思维导图】
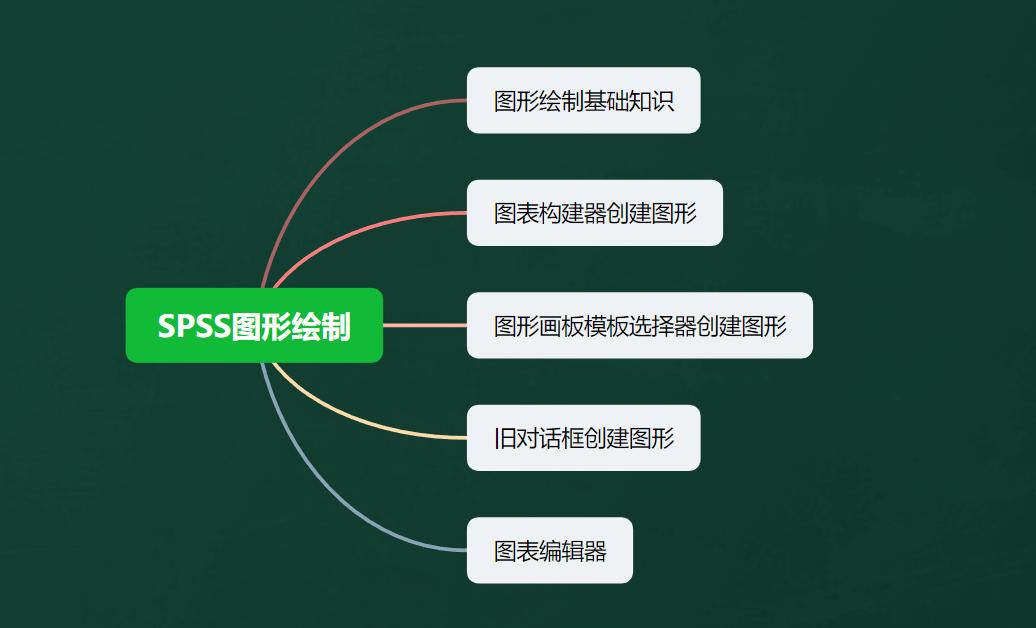
【基础知识】
大量的统计数据显得纷繁复杂,研究者很难看出其中所蕴含的信息,而借助于图表,研究者很容易看出图表所体现的数据的分布规律、发展趋势、数量多少和相互关系等信息。图表中包含的信息极多,因为大量数据都能概括在图中,并且一眼就能被理解。俗话说:“一幅图胜过一千个字”,做图的主要目的有两个:帮助研究者从数据中提取信息和帮助把信息传给其他人。
A large number of statistical data appear complicated, it is difficult for researchers to see the information contained in them. With the help of charts, researchers can easily see the data distribution law, development trend, quantity and mutual relationship embodied in charts. There is a lot of information in the diagram, because a large amount of data can be summarized in the diagram and can be understood at a glance. As the saying goes, "A picture is worth a thousand words", the main purpose of drawing is twofold: to help researchers extract information from data and to help pass it on to others.
SPSS的制图功能很强,可以绘制许多种统计图形,包括条形图、线图、饼图、箱图、直方图以及3D图等。这些图形可以由各种统计分析过程生成,也可以直接由图形菜单中所包含的一系列图形过程直接生成。本章主要介绍根据数据直接绘制统计图的过程,即图形菜单中各菜单项所具有的功能。
SPSS has a strong mapping function and can draw many kinds of statistical graphs, including bar charts, line charts, pie charts, box charts, histograms and 3D charts. These graphs can be generated by various sub-statistical analysis processes, or directly by a series of graphical processes included in the graphical menu. This chapter mainly introduces the process of drawing statistical chart directly according to data, that is, the functions of each menu item in graphical menu.
SPSS创建图形的一般过程可分为三个阶段:
第一,建立数据文件,在数据窗口录入数据,或从其他数据文件中读取数据。
第二,利用SPSS的图形模块或其他过程生成图形。
第三,编辑修饰生成的图形,新生成的图形往往不符合统计图要求,例如图形题目、标尺的单位等,可对其做些调整修饰。
The general process of creating graphics in SPSS can be divided into three stages:
First, create a data file, enter data in the data window, or read data from other data files.
Second, use SPSS graphics module or other processes to generate graphics.
Third, edit and modify the generated graphics, and the newly generated graphics often do not meet the requirements of statistical charts, such as graphics topics, ruler units, etc., which can be adjusted and modified.
统计图形的生成与数据文件的结构和类型紧密相关,同一数据来源,整理成不同结构的数据文件,在生成图形时,条形图生成对话框中参数设置会有所不同。数据文件的整理会直接影响图形生成的参数选择,当不能满足图形生成的要求时,还需对数据文件的结构做适当的调整。
The generation of statistical graphs is closely related to the structure and type of data files. If the same data source is sorted into data files with different structures, the parameter settings in the bar graph generation dialog box will be different when generating graphs. The arrangement of data files will directly affect the parameter selection of graphics generation. When the requirements of graphics generation cannot be met, it is necessary to adjust the structure of data files appropriately.
我们在前面介绍了统计数据的标度尺度,由低级向高级分为:名义尺度、定序尺度、间隔尺度。其中,名义尺度的测量水平最低,变量的取值仅代表一定的分类或标识,测量值之间没有大小可言。对应的变量类型,可以是数值型,也可以是字符型;定序尺度的测量水平次之,保存测量值之间的一种有序关系,测量值之间有大小关系,但不能做加减的运算,对应的变量类型可以是数值型也可以是字符型;测量水平最高的是间隔尺度,测量值之间可做运算,对应的变量类型只能是数值型。
We introduced the scale scale of statistical data in front, which is divided into nominal scale, sequential scale and interval scale from low level to high level. Among them, the measurement level of nominal scale is the lowest, the value of variables only represents a certain classification or identification, and there is no size between the measured values. The corresponding variable type can be numeric or character; The measurement level of sequencing scale is second, and an ordered relationship between the measured values is preserved. There is a size relationship between the measured values, but the addition and subtraction operations cannot be done, and the corresponding variable types can be numerical or character types; The highest measurement level is the interval scale, and the measured values can be calculated, and the corresponding variable type can only be numerical type.
在定义变量时,需在度量标准栏中设置其度量尺度(也称为测量级别),其在数据分析中的作用不太明显,但用在图表生成器绘制图形时却很重要,度量尺度设置不正确将会影响图形的绘制。
When defining a variable, it is necessary to set its metric scale (also called measurement level) in the metric bar, which is not obvious in data analysis, but it is very important when drawing graphics in chart generator. Incorrect setting of metric scale will affect the drawing of graphics.
下期预告:本期,我们学习了图表的基本认知。下一期,我们将会学习使用图表编辑器创建图形。
Next issue notice: In this issue, we learned the basic cognition of charts. In the next installment, we will learn how to create graphics using the diagram editor.
如果您对今天的文章有独特的想法,欢迎给我们留言,让我们相约明天,祝您今天过得开心快乐!
If you have a unique idea of today's article, welcome to leave us a message, let us meet tomorrow, I wish you a happy today!
参考资料:《SPSS23(中文版)统计分析实用教程》、百度百科
翻译:讯飞语音
本文由learningyard新学苑原创,部分图片文字来源于他处。如有侵权,请联系删除。