
每个投资者都知道,投资不能盲目投资瞎投资,不知道市场状态,市场当前所处的历史位置,不知道现在的市场情绪,长期以往是很难获得投资成功的,因此我们就要不断的研究,去认识市场,去感知市场,与市场同步,这样可能长期下去,或许可能让投资清楚明白。
那么作为一个量化投资者来说,我们该如何了解市场的位置和状态呢。YU股思基开发了一个行业市场温度计,以此来跟踪市场所处的历史水平和位置,每个人关注的因子都不太一样,这里仅仅是YU股思基的一个方法,这里风分享给大家。
Python量化实现行业温度计自动生成
行业温度计实现主要逻辑:
1.获取31个申万一级行业的估值数据市盈率PE市净率PB计算任意历史区间的估值数据水位(可设置)YU股思基使用的是滚动近五年的数据
2.根据市盈率和10年期国债收益率计算行业ERP因子和因子所处水位依然是近五年的水位
3.获取每日行业的涨跌幅和今年以来的涨跌幅关注行业的当前行情
4.按照三个因子PE、PB、ERP三个因子的水位分配权重30%、30%、40%,得到31个行业综合温度计水平和位置
Python量化实现代码:
1.导入相关模块和库设置金融数据接口
import pandas as pd
import tushare as ts
import akshare as ak
import time
import datetime
from dateutil.relativedelta import relativedelta
import warnings
warnings.filterwarnings('ignore') #忽略弃用模块警告


#tushare接口授权
token = '你的接口'
pro = ts.pro_api(token=token)
ts.set_token(token=token) #使用复权行情必须设置接口token
2.定义一个类功能是:计算某个时间的固定窗口期的前一个时间,时间间隔可以是年月日
'''
定义一个类,功能是:计算某个时间的固定窗口期的前一个时间,时间间隔可以是年、月、日
'''


class Cal_Last_Date():
    #类的初始化
    def __init__(self,date,delta_num): #这个是类的特殊方法,在的类的实例化时即被调用
        self.date = date
        self.delta_num = delta_num


    #以年为间隔
    def datedelta_by_year(self):
        end_date = pd.to_datetime(self.date) #用pandas把字符串时间转换为日期格式
        start_date = (end_date + relativedelta(years = self.delta_num)).strftime("%Y%m%d")
        # print(start_date)
        return start_date


    # 以月为间隔
    def datedelta_by_month(self):
        end_date = pd.to_datetime(self.date)  # 用pandas把字符串时间转换为日期格式
        start_date = (end_date + relativedelta(months = self.delta_num)).strftime("%Y%m%d")
        # print(start_date)
        return start_date


    # 以天为间隔
    def datedelta_by_day(self):
        end_date = pd.to_datetime(self.date)  # 用pandas把字符串时间转换为日期格式
        start_date = (end_date + relativedelta(days = self.delta_num)).strftime("%Y%m%d")
        # print(start_date)
        return start_date
3.定义一个计算一组数据分为数的函数和方法
'''
计算每个数在一组数据中的分位值
'''


def cal_percentile(data_list):
    num_percentile_list = []
    sort_data_list = sorted(data_list)
    # print(sort_data_list)
    for num in data_list:
        num_index = sort_data_list.index(num)
        # print(num_index)
        num_percentile = round(((num_index + 1)/len(sort_data_list))*100,2) #百分位值
        # print(num_percentile)
        num_percentile_list.append(num_percentile)
    return num_percentile_list
4.定义一个获取申万31个一级行业的历史行情的方法
'''
行业表现:申万一级行业,历史行情
'''


def get_industry_themometer_info(date):
    #获取最终字段
    columns = ['交易日期','行业名称','收盘价','涨跌幅(%)','PE','PE_温度','PB','PB_温度','ERP','ERP_温度','今年以来收益(%)','行业综合温度']
    df = pd.DataFrame(columns=columns)
    # 10年期国债收益率
    bond_zh_us_rate_df = ak.bond_zh_us_rate()
    df_bond_10 = bond_zh_us_rate_df[['日期', '中国国债收益率10年']]
    df_bond_10.columns = ['trade_date', 'Bond10Year']
    df_bond_10['trade_date'] = df_bond_10['trade_date'].astype(str)
    df_bond_10['trade_date'] = df_bond_10['trade_date'].str.replace('-', '')
    #申万31个一级行业代码
    sw_industry_code_list = ['801120.SI','801980.SI','801200.SI','801770.SI','801760.SI','801750.SI','801730.SI','801140.SI','801050.SI',
                             '801010.SI','801130.SI','801110.SI','801030.SI','801080.SI','801230.SI','801740.SI','801790.SI','801960.SI',
                             '801880.SI','801710.SI','801040.SI','801150.SI','801210.SI','801890.SI','801170.SI','801970.SI','801160.SI',
                             '801780.SI','801720.SI','801180.SI','801950.SI']
    #设置计算时长
    cal_date = Cal_Last_Date(date=date, delta_num=-5)
    last_5years_date = cal_date.datedelta_by_year()
    for code in sw_industry_code_list:
        columns_for = ['交易日期','行业名称','收盘价','涨跌幅(%)','PE','PE_温度','PB','PB_温度','ERP','ERP_温度','行业综合温度']
        df_for = pd.DataFrame(columns=columns_for)
        #获取当日行情和年初第一天行情,计算今年以来收益率
        df_sw_industry = pro.sw_daily(ts_code=code, start_date=date, end_date=date)
        start_date_2022 = '20220104'
        df_sw_industry_start_date_2022 = pro.sw_daily(ts_code=code, start_date=start_date_2022, end_date=start_date_2022)
        # print(df_sw_industry_start_date_2022)
        pct_change_2022 = round(((df_sw_industry['close'][0]-df_sw_industry_start_date_2022['close'][0])/df_sw_industry_start_date_2022['close'][0])*100,2)
        # print(pct_change_2022)
        # 计算各指标近5年的分位数温度,PE,PB,ERP
        #获取五年前的时间,并获取分位数据
        df_sw_industry_5years = pro.sw_daily(ts_code=code, start_date=last_5years_date, end_date=date)
        pe_list = df_sw_industry_5years['pe'].tolist()
        pb_list = df_sw_industry_5years['pb'].tolist()
        pe_percentile_list = cal_percentile(pe_list)
        pb_percentile_list = cal_percentile(pb_list)
        df_sw_industry_5years['pe_percentile'] = pe_percentile_list
        df_sw_industry_5years['pb_percentile'] = pb_percentile_list
        #计算ERP
        df_sw_industry_5years_ERP = df_sw_industry_5years.merge(df_bond_10,how='left',on='trade_date')
        df_sw_industry_5years_ERP['ERP'] = round(((1/df_sw_industry_5years_ERP['pe'])*100-df_sw_industry_5years_ERP['Bond10Year']),2)
        ERP_list = df_sw_industry_5years_ERP['ERP'].tolist()
        ERP_percent_list = cal_percentile(ERP_list)
        df_sw_industry_5years_ERP['ERP_percentile'] = ERP_percent_list
        df_sw_industry_5years_ERP['Thermometer'] = round(df_sw_industry_5years_ERP['pe_percentile']*0.3 + df_sw_industry_5years_ERP['pb_percentile']*0.3 + df_sw_industry_5years_ERP['ERP_percentile']*0.4,2) #按照各指标赋予权重
        df_sw_industry_5years_ERP = df_sw_industry_5years_ERP[['trade_date','name','close','pct_change',
                                                               'pe','pe_percentile','pb','pb_percentile','ERP','ERP_percentile','Thermometer']]
        #数据处理结果
        df_result = df_sw_industry_5years_ERP
        df_result.columns = columns_for
        # df_result['今年以来收益'] = pct_change_2022
        df_for.loc[len(df_for)] = df_result.loc[0].values
        df_for['今年以来收益(%)'] = [pct_change_2022]
        #对结果数据字段重新排序
        df_for = df_for[['交易日期','行业名称','收盘价','涨跌幅(%)','PE','PE_温度','PB','PB_温度','ERP','ERP_温度','今年以来收益(%)','行业综合温度']]
        df.loc[len(df)] = df_for.loc[0].values
    # print(df)
    return df
5.定义量化的主逻辑代码
if __name__ == '__main__':
    # 记录程序执行时间
    start_time = time.time()
    print('行业市场综合温度计开始执行.....')


    #保存最终结果数据
    ExcelWriter = pd.ExcelWriter('Industry_Thermometer.xlsx')
    # 获取当天日期
    today_date = datetime.datetime.now().strftime("%Y%m%d")
    # 交易日
    Last_trade_date = get_last_trade_date(date=today_date)


    current_time = time.time()
    print('程序已执行:' + str(round(current_time - start_time, 2)) + 's')


    df = get_industry_themometer_info(date=Last_trade_date)
    df.sort_values(by='涨跌幅(%)',inplace=True,ascending=False) #按涨跌幅降序排列
    df['序号'] = [x for x in range(1,len(df) +1)] #
    df = df[['序号','交易日期','行业名称','收盘价','涨跌幅(%)','PE','PE_温度','PB','PB_温度','ERP','ERP_温度','今年以来收益(%)','行业综合温度']]


    current_time = time.time()
    print('程序已执行:' + str(round(current_time - start_time, 2)) + 's')


    df.to_excel(excel_writer=ExcelWriter,sheet_name='温度计',index=False,startrow=1)
    ExcelWriter.close()


    current_time = time.time()
    print('程序已执行:' + str(round(current_time - start_time, 2)) + 's')


    print('当日温度计数据已生成,请查看....')
(想要获取完整代码关注YU股思基,私信获取)
Python量化实现结果如下:
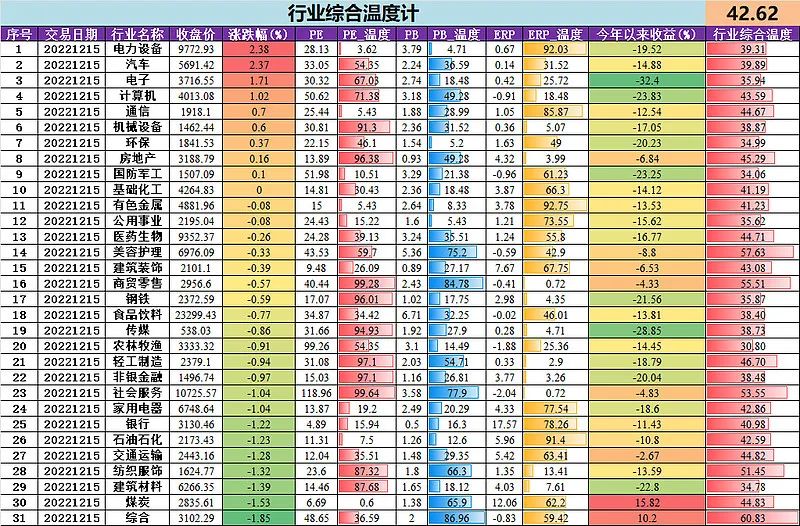
通过结果大家可以每日跟踪市场各行业和行情,并清楚的看出行业的位置对做好行业轮动具有很好的参考意义。
但是大家要注意的是,没有任何一个方法跟踪市场是完全正确的,只能是对我们的认知起到很好的辅助作用。
坚持理性研究,量化投资,做有价值的事情,做正确的事情,坚定信心,静待开花结果。
免责声明:投资有风险,投资需谨慎!本文仅为根据市场公开资料及个人理解研究分析,不作为投资依据,文中涉及到的标的仅作为举例,不构成投资建议,所提到的观点仅代表个人的意见,所涉及标的不作推荐,风险自负。
坚持不易,点赞、关注、分享三连击!